PptxGenJS Presentation
Scene 1 (0s)
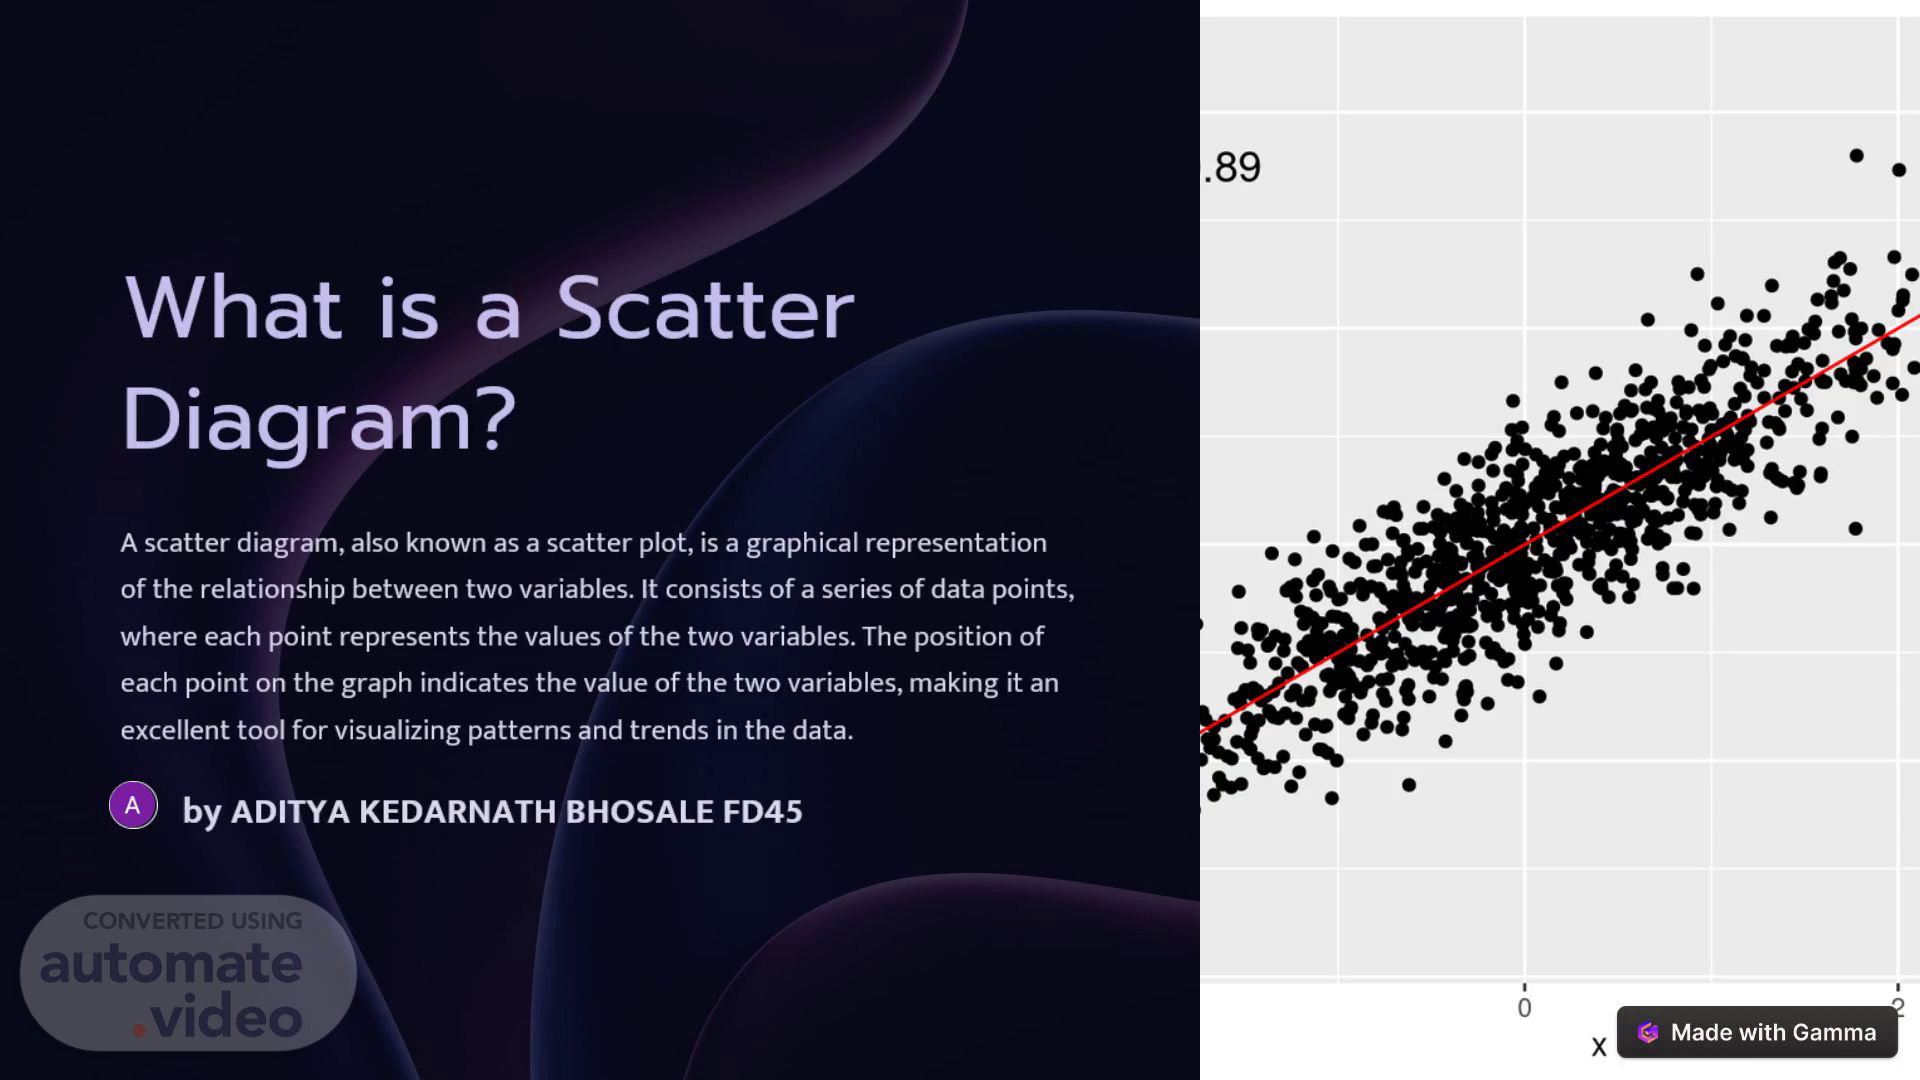
.89. What is a Scatter Diagram?. A scatter diagram, also known as a scatter plot, is a graphical representation of the relationship between two variables. It consists of a series of data points, where each point represents the values of the two variables. The position of each point on the graph indicates the value of the two variables, making it an excellent tool for visualizing patterns and trends in the data..
Scene 2 (23s)
Purpose of a Scatter Diagram. Identifying Relationships.
Scene 3 (55s)
Types of Scatter Diagrams. Linear Scatter Diagram.
Scene 4 (1m 24s)
-0.94 +0.08. Positive Correlation Scatter Diagram.
Scene 5 (1m 51s)
Negative Correlation Scatter Diagram. Definition.
Scene 6 (2m 12s)
(b) Negative linear -.70 (d) Curvilinear r = 0.00.
Scene 7 (2m 39s)
How to Create a Scatter Diagram. 1. Data Collection.
Scene 8 (3m 4s)
Benefits of Using Scatter Diagrams. Visual Representation.