Scene 1 (0s)
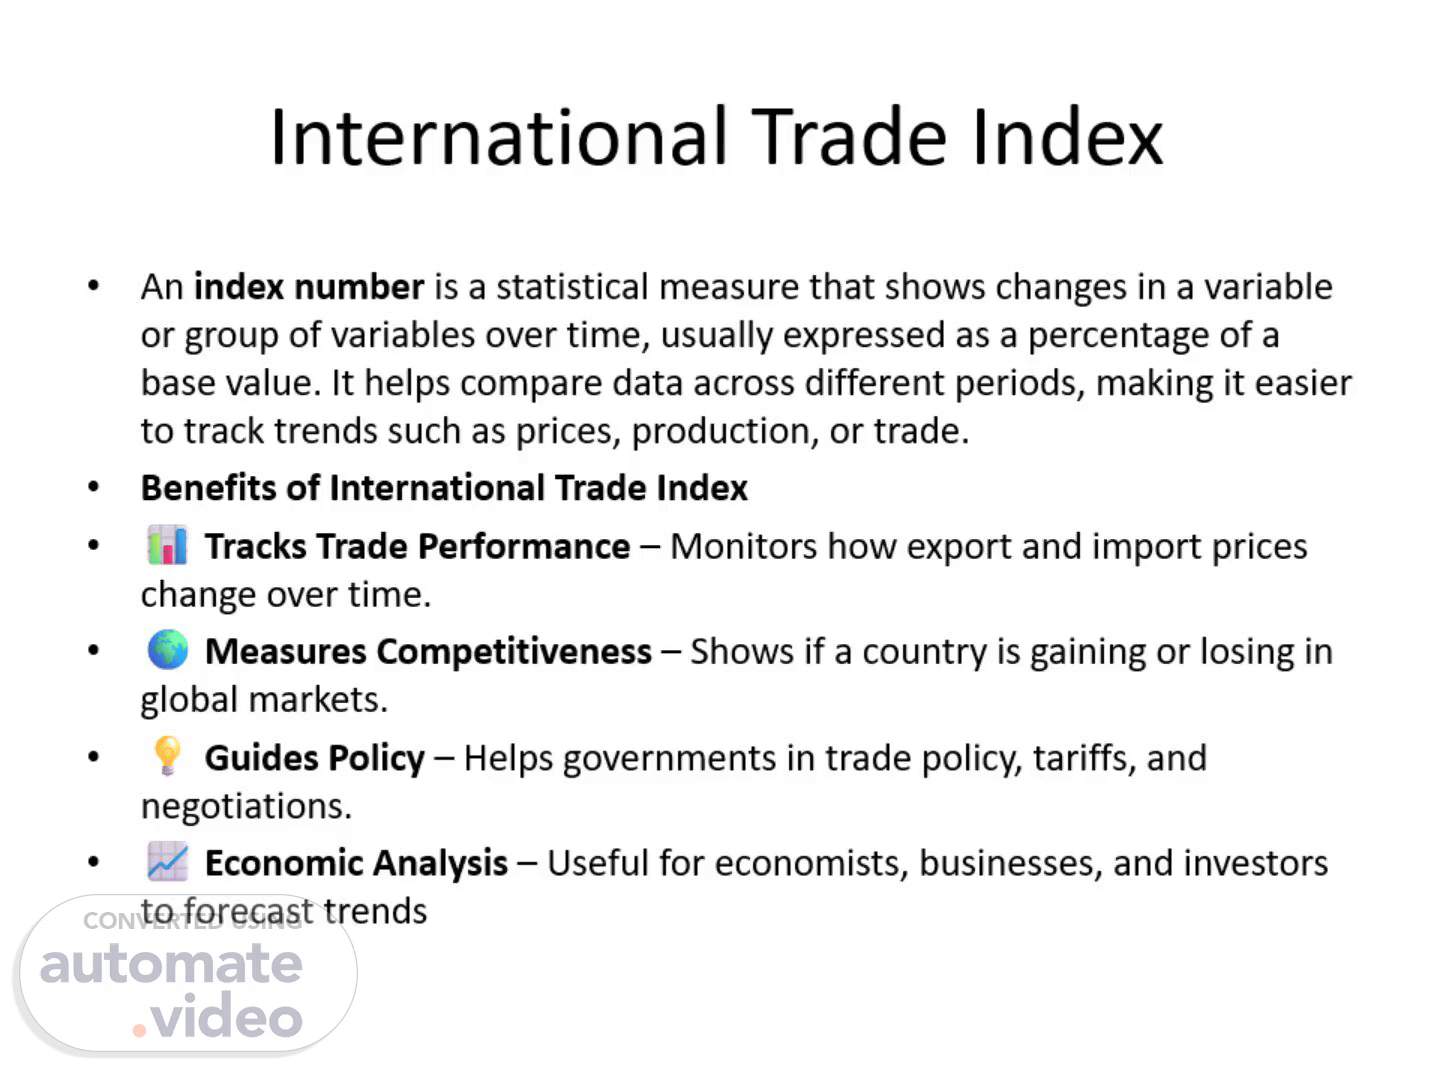
[Audio] International Trade Index An index number is a statistical measure that shows changes in a variable or group of variables over time, usually expressed as a percentage of a base value. It helps compare data across different periods, making it easier to track trends such as prices, production, or trade. Benefits of International Trade Index 📊 Tracks Trade Performance – Monitors how export and import prices change over time. 🌍 Measures Competitiveness – Shows if a country is gaining or losing in global markets. 💡 Guides Policy – Helps governments in trade policy, tariffs, and negotiations. 📈 Economic Analysis – Useful for economists, businesses, and investors to forecast trends.
Scene 2 (51s)
[Audio] Laspeyres Price Index Formula: PL=∑(P1⋅Q0)/∑(P0⋅Q0)×100 P1 = prices in the current year P0 = prices in the base year Q0 = quantities in the base year (weights) Uses base-year weights. Tends to overestimate price increases..
Scene 3 (1m 18s)
[Audio] Solving table Base Year: 2020 Export Price Index (EPI) & Import Price Index (IPI) calculated using value method. Terms of Trade (TOT) = (EPI / IPI) × 100 Highest TOT in 2020 = 100.00 Lowest TOT in 2022 = 93.10 Year Export_Value Import_Value Export_Index Import_Index TOT_Index 2020 500 450 100 100 100.00 2021 550 500 110 111.11 99.00 2022 600 580 120 128.89 93.10 2023 660 620 132 137.78 95.81.
Scene 4 (2m 40s)
[Audio] Graph The graph shows that both export and import values increased since 2020 But imports grew faster, causing the Terms of Trade to drop below 100 After 2021—meaning the country’s export purchasing power declined..
