Scene 1 (0s)
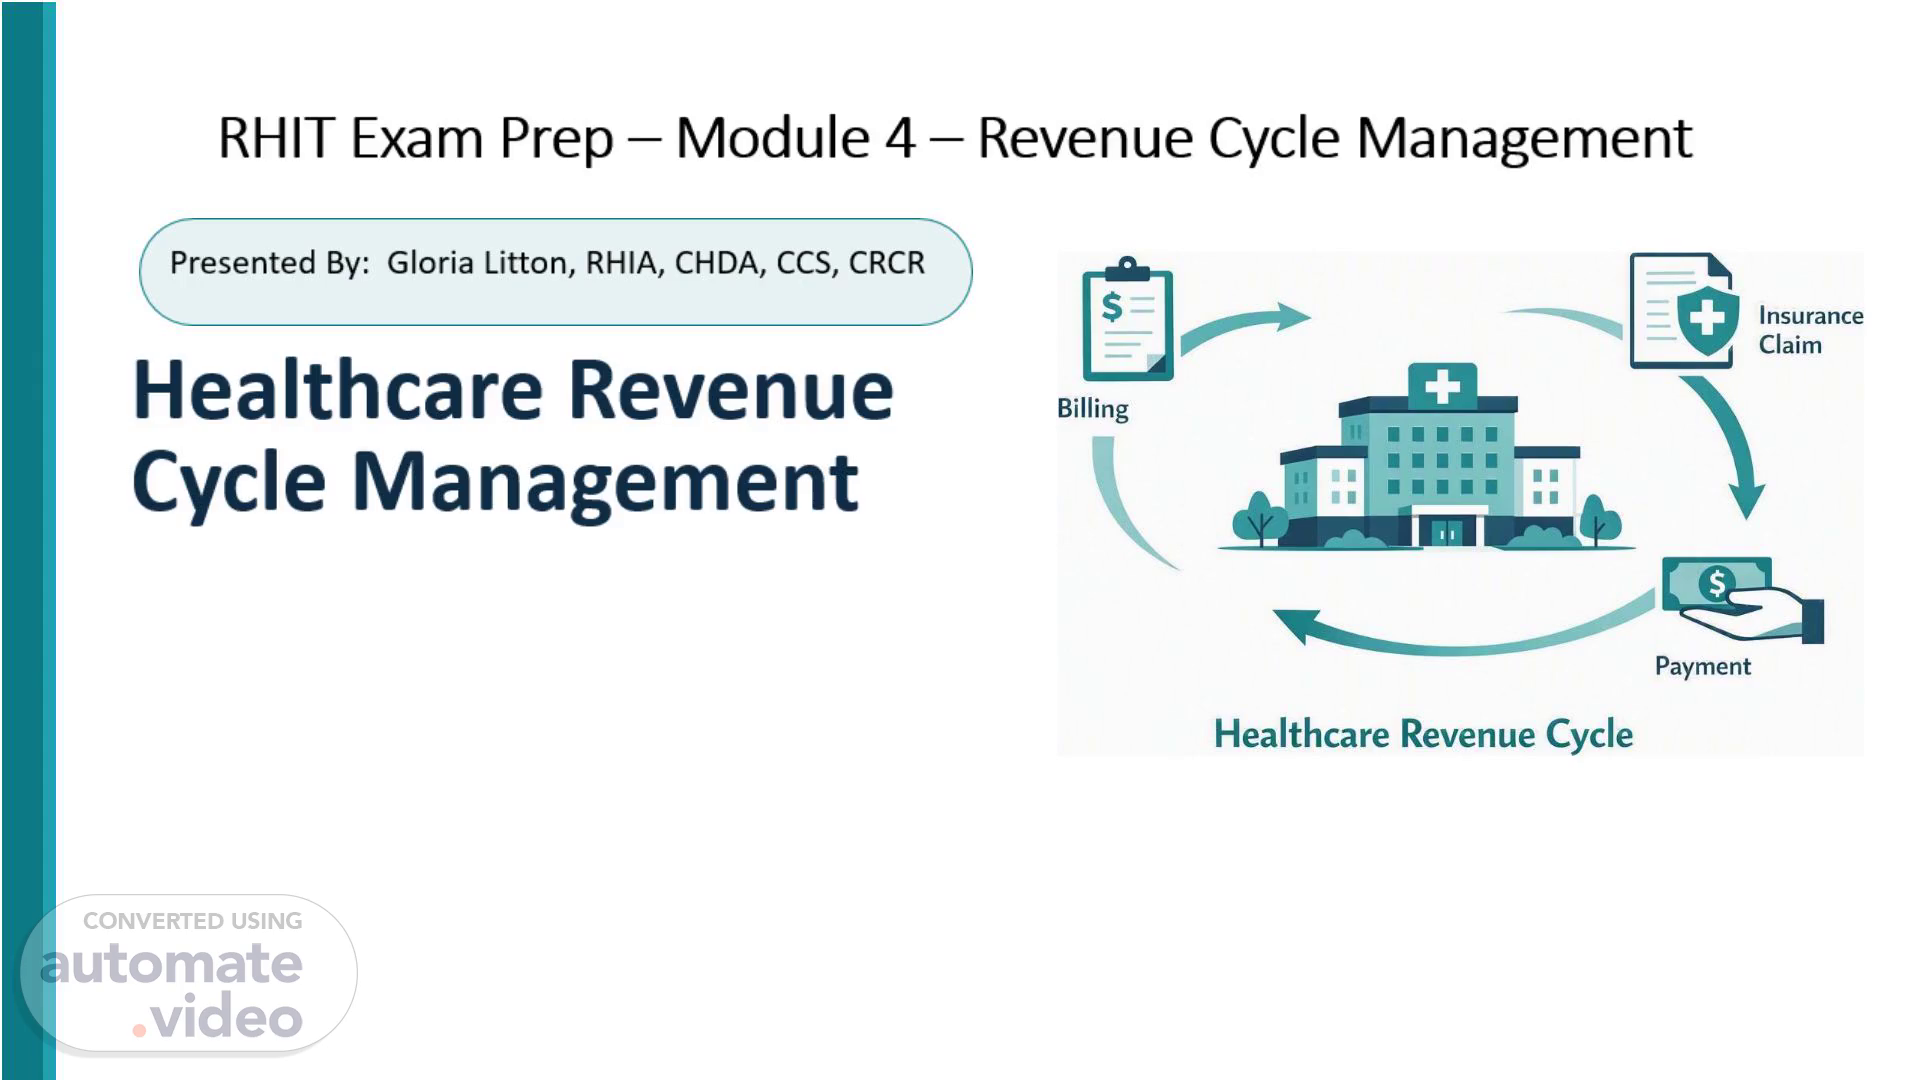
[Audio] R-H-I-T Exam Prep – Module 4 – Revenue Cycle Management Presented By: Gloria Litton, RHIA, CHDA, C-C-S--, C-R-C-R Healthcare Revenue Cycle Management A practical guide to the revenue cycle workflow, denial management, and recovery for coding, billing and operations teams. Front End Access · Coding & Charge · Denials & Recovery Prepared July 2026 Welcome. This is Module 4 of the R-H-I-T exam prep series, focused on revenue cycle management. I am Gloria Litton, the VHimA coding roundtable coordinator and I will be your guide as we walk through the cycle end to end – including front end access, coding and charge capture, then denials and recovery. The goal is to understand where revenue leaks happen and what each role can do about it..
Scene 2 (1m 6s)
[Audio] Why It Matters The Financial Stakes of the Revenue Cycle Denials and revenue leakage are accelerating — and most of it is preventable at the source. 11.6% 65% $48.4B $262B Net revenue U S hospitals lost to denials and uncollected balances in 2025 — up 25% year over year. Average initial claim denial rate in 2025, a continued climb from prior years. Annual cost of claim denials industry wide — an estimated 86% of them avoidable. Share of denied claims that are never reworked or resubmitted — revenue simply left behind. Sources: Kodiak Solutions Revenue Cycle Analytics (2026, 2300 plus hospitals); industry denial management research, 2025–2026. Healthcare Revenue Cycle Management Operational Playbook · Billing & R-C-M Teams $48.4B in net revenue was lost by U S hospitals to denials and uncollected balances in 2025 up 25% year over year. Initial denial rates now average 11.6% and keep climbing; industry wide denial cost is about $262B a year, and roughly 86% of those denials were avoidable. The number that usually lands hardest: 65% of denied claims are never reworked. That is earned revenue simply abandoned. Source note: Kodiak Solutions revenue cycle analytics covering 2300 plus hospitals, plus 2025-2026 denial management research..
Scene 3 (3m 0s)
[Audio] Revenue Cycle The billing and payment workflow Used to manage the administrative functions that concern revenue generation, forms of payment, and claims processing Process includes: scheduling and registration Patient care and clinical documentation Coding and claim submission Payment or denials management The revenue cycle is the billing and payment workflow that manages revenue generation, forms of payment, and claims processing. The cycle starts with scheduling and registration; patient care and clinical documentation; coding and claim submission; payment or denials management. Exam tip: candidates are often asked to place an activity in the correct phase of the cycle practice thinking in sequence..
Scene 4 (3m 49s)
[Audio] The Big Picture The Revenue Cycle at a Glance Every dollar earned flows through three connected stages — from the first patient contact to the final payment posted. Front End Mid Cycle Back End Patient Access Coding & Charge Capture Billing & Collections Scheduling & registration Eligibility & benefits Prior authorization Cost estimates Clinical documentation Charge capture Medical coding Claim scrubbing Claim submission Payment posting Denial management A/R follow up A breakdown in any single stage cascades downstream — driving up A/R days, denials, and write offs. Healthcare Revenue Cycle Management Operational Playbook · Billing & R-C-M Teams This is the map for the whole module three connected stages, front end, mid cycle, back end. Front end owns patient access: scheduling, eligibility, prior authorization, cost estimates. Mid cycle owns clinical documentation, charge capture, coding, and claim scrubbing. Back end owns claim submission, payment posting, denial management, and A/R follow up. Key message: a breakdown in any single stage cascades downstream it shows up as higher A/R days, more denials, and bigger write offs..
Scene 5 (5m 16s)
[Audio] Stage 01 Front End: Patient Access Scheduling & Pre Registration Capture accurate demographic and insurance details before the encounter. Eligibility & Benefits Verification Front end Confirm active coverage, plan rules, and patient responsibility up front. Get it right before the visit Prior Authorization Secure required approvals to avoid preventable medical necessity denials. Clean, verified data at intake prevents downstream errors. Roughly half of all denials trace back to front end gaps in registration, eligibility, and authorization. Patient Cost Estimates Set clear expectations and collect point of service payments. Financial Counseling Screen for assistance, set up plans, and reduce bad debt risk early. ~50% of denials originate in the front end revenue cycle. Stage 01. the Front End Everything here happens before or at the moment of the visit. Five activities: scheduling and pre registration, eligibility and benefits verification, prior authorization, patient cost estimates, and financial counseling. About half of all denials originate in the front end registration, eligibility, and authorization gaps.Clean data at intake is the cheapest denial prevention available. Fixing it here costs minutes; fixing it later costs an appeal..
Scene 6 (6m 46s)
[Audio] Scheduling and Pre Registration Patient pre registration is the process of collecting relevant patient information before the day of the scheduled visit. Like the regular patient intake process followed at the facility, pre registration practices capture demographics, clinical data, and insurance information. Pre registration is typically used when a patient is being scheduled for treatment in the future and patient details must be recorded in the hospital scheduling system to book this treatment and note any important details ahead of time. Pre registration must be used when scheduling both inpatient and outpatient elective surgery and outpatient booked procedures such as: MRIs CT scans Mammography Nuclear medicine Endoscopies Echocardiograms (and many, many more!) Pre registration is collecting relevant patient information before the day of the scheduled visit. It captures the same elements as regular intake: demographics, clinical data, and insurance information. It is used when treatment is scheduled for the future so details are in the scheduling system ahead of time. Required for inpatient and outpatient elective surgery and booked outpatient procedures MRIs, CT scans, mammography, nuclear medicine, endoscopies, echocardiograms, and many more..
Scene 7 (8m 14s)
[Audio] Health Insurance and Health Benefits Programs Regulations constantly change Obtain most current information directly from insurance plan or program. Insurance process is integral part of medical billing Claims must be accurate In health insurance, regulations constantly change and as an Him or Revenue Cycle professional you must stay versed on the most current regulations and the changes as they occur..
Scene 8 (8m 42s)
[Audio] Insurance Terminology Policy – an agreement between an insurer (insurance company) and an individual or group. Specifies the type of health care treatment that is covered and what amounts will be paid by the plan Insured/subscriber – the individual who holds the insurance policy Beneficiary – any individual who qualifies for benefits under that subscriber policy Copayment – amount paid each time the patient is treated by a health care provider. A set amount that must be paid by a patient or policyholder for each encounter Coinsurance – a percentage of the claim required to be paid by the patient Deductible – a specific amount a patient must pay each year before insurance benefits will be paid Let’s walk through some of the key terminology related to insurance programs; These definitions may show up on the exam and in daily denial work. A Policy is an agreement between the nsurer and an individual or group, specifying covered treatment and amounts paid. Insured/subscriber holds the policy; beneficiary is anyone qualifying for benefits under it. Copayment is a set amount per encounter. Coinsurance is a percentage of the claim. Deductible is the annual amount the patient pays before benefits begin. Common confusion to call out: copay versus coinsurance versus deductible..
Scene 9 (9m 13s)
[Audio] Centers for Medicare and Medicaid Services (C-M-S--) Agency of federal government – part of the U-S Department of Health and Human Services Oversees Medicare, Medicaid, State Children’s Health Insurance Program Evaluates the quality of health care services Studies the effectiveness of matters related to health care services Sets policy for payment for health care services CMS is a federal agency within the U S Department of Health and Human Services. It oversees Medicare, Medicaid, and the State Children's Health Insurance Program. It also evaluates quality of care, studies effectiveness of health care services, and sets payment policy. C-M-S payment policy drives much of what commercial payers adopt..
Scene 10 (10m 4s)
[Audio] Medicare The federal health insurance program for: People who are 65 or older Certain younger people with disabilities People with End Stage Renal Disease (permanent kidney failure requiring dialysis or a transplant, sometimes called E-S-R-D-) Established in 1965 with the passage of the Social Security Act As the largest single payer, accurate eligibility and enrollment checks are essential to clean claims. Medicare is the federal health insurance program for people 65 or older, certain younger people with disabilities, and people with End Stage Renal Disease. Established in 1965 with the passage of the Social Security Act. As the largest single payer, accurate eligibility and enrollment checks are essential to producing clean claims..
Scene 11 (10m 58s)
[Audio] Payer Foundations The Parts of Medicare Part A — Hospital Insurance A The Big Picture Covers inpatient hospital stays, skilled nursing, hospice, and some home health; usually premium free. Medicare: One program, four parts Part B — Medical Insurance B Covers physician and outpatient services, preventive care, and durable medical equipment; monthly premium. Each part carries its own coverage, billing, and authorization rules teams must know. Part C — Medicare Advantage C Private plans that bundle Parts A and B, often adding drug coverage and extra benefits. Part D — Prescription Drug Coverage D Outpatient prescription drug coverage sold through private, Medicare approved plans with formularies. Medigap — Supplement Insurance plus Optional private coverage that helps pay costs Original Medicare leaves behind, like copays and deductibles. Healthcare Revenue Cycle Management Operational Playbook · Billing & R-C-M Teams Four parts plus a supplement know what each covers and who bills it. Part A, hospital insurance: inpatient stays, skilled nursing, hospice, some home health; usually premium free. Part B, medical insurance: physician and outpatient services, preventive care, durable medical equipment; monthly premium. Part C, Medicare Advantage: private plans bundling A and B, often with drug coverage and extra benefits. Part D: outpatient prescription drug coverage through private Medicare approved plans with formularies. Medigap: optional private coverage for costs Original Medicare leaves, like copays and deductibles. Each part carries its own coverage, billing, and authorization rules..
Scene 12 (13m 3s)
[Audio] Stage 02 Mid Cycle: Charge Capture & Coding Clinical Documentation Integrity Ensure notes fully support the services and severity billed. Charge Capture Mid cycle Record every billable service — no missed or dropped charges. Translate care into a clean claim Medical Coding Assign accurate CPT, ICD-10, and modifier codes to each encounter. The mid cycle turns clinical services into accurate, compliant charges. Missed charges and coding errors are silent revenue leaks that also drive audit risk. Claim Scrubbing & Edits Run automated edits to catch errors before submission. Compliance Review Validate coding against payer and regulatory rules to reduce takebacks. First pass accuracy here is what protects your clean claim rate. Stage 02 where clinical care becomes a billable, compliant claim. Five activities: clinical documentation integrity, charge capture, medical coding, claim scrubbing and edits, and compliance review. Missed charges and coding errors are silent revenue leaks nobody gets a denial letter for a charge that was never captured. First pass accuracy here is what protects the clean claim rate, and it also reduces audit and takeback risk..
Scene 13 (14m 27s)
[Audio] Stage 03 Back End: Billing, Collections & A/R Claim Submission File clean claims promptly to payers within timely filing limits. Payment Posting & Reconciliation Back end Post remittances accurately and reconcile against expected reimbursement. Convert claims into cash Denial Management Triage, appeal, and rework denials with root cause tracking. The back end submits, tracks, and collects. Disciplined follow up and denial work here determine how much earned revenue is actually realized. A/R Follow Up Work aging buckets aggressively — prioritize AR over 90 days. Patient Collections Offer clear statements and flexible, compassionate payment options. Up to 65% of denied claims are never reworked — disciplined follow up recovers them. Stage 03 converting claims into cash. Five activities: claim submission within timely filing limits, payment posting and reconciliation, denial management, A/R follow up, and patient collections. Prioritize aging buckets, especially A/R over 90 days. Return to the recovery stat: up to 65% of denied claims are never reworked. Disciplined follow up is where that money comes back. Patient collections should be clear and compassionate flexible options collect more than aggressive ones..
Scene 14 (16m 3s)
[Audio] The Insurance Claim Process After all the required information is entered onto the claim form, the claim is submitted electronically to the insurance carrier Electronic data interchange (E-D-I--) – to exchange business information between two organizations electronically instead of using paper documents Edits designed to help ensure the accuracy of claims for payment for health care items and services. Information includes the guarantor information, the insurance carrier information including the group and policy numbers, all diagnosis and procedure codes associated with the visit in addition to the associated charges for those services An Explanation of Benefits (E-O-B--) form is submitted by the insurance carrier to the patient and provider identifying the covered amounts, the payment made, and the amount the patient is responsible for. This also indicates any portion that is applied to the deductible and any coinsurance that is applied Let’s trace a single claim end to end: registration, documentation, coding, submission, adjudication, remittance, and either payment posting or denial work..
Scene 15 (17m 17s)
[Audio] Measure What Matters The K-P-I's Every R-C-M Team Should Track A KPI (Key Performance Indicator) is a quantifiable measure used to evaluate how effectively an organization, team, or individual is achieving specific objectives. Benchmark consistently against national standards — these six metrics reveal where cash is stuck and revenue leaks. < 40 days ≥ 95% > 85% Days in A/R Clean Claim Rate First Pass Resolution Target Target Target Average time from service to payment — the top gauge of cash flow velocity. Share of claims accepted on first submission with no edits. Claims paid on the first pass without rework or appeal. ≥ 95% < 25% < 5–8% Net Collection Rate A/R Over 90 Days Denial Rate Target Target Target Percentage of collectible revenue actually captured. Portion of receivables aging past 90 days — lower is healthier. Claims denied on first submission; industry average is now 11.6%. Healthcare Revenue Cycle Management Operational Playbook · Billing & R-C-M Teams Define K-P-I first: a quantifiable measure of how effectively a team is achieving specific objectives. Six metrics to benchmark consistently: Days in A/R under 40; clean claim rate at or above 95%; first pass resolution above 85%. Then: net collection rate at or above 95%; A/R over 90 days under 25%; denial rate under 5-8% against an industry average now at 11.6%. These six areas together show where cash is stuck and where revenue is leaking. Encourage trending over time rather than reacting to a single month..
Scene 16 (18m 4s)
[Audio] The Problem The Denials Landscape 11.6% average initial denial rate (2025) 15% of private payer claims denied on first pass of denials are considered avoidable 86% Top root causes Eligibility & registration errors at intake Missing or expired prior authorizations Coding errors and insufficient documentation Missed timely filing and submission deadlines Medical necessity and payer policy mismatches From denied to recovered The denials problem in numbers: 11.6% average initial denial rate in 2025, about 15% of private payer claims denied on first pass, and 86% of denials considered avoidable. Top root causes: eligibility and registration errors at intake, missing or expired prior authorizations, coding errors and insufficient documentation, missed timely filing deadlines, and medical necessity or payer policy mismatches. Key takeaway: most denials are process failures, not payer surprises which means they are fixable..
Scene 17 (19m 19s)
[Audio] The Solution Denial Management & Recovery Workflow A closed loop process turns denials from a reactive headache into a systematic, revenue recovering discipline. Identify & Triage Analyze Root Cause Appeal & Rework Prevent & Improve Capture every denial, categorize by reason code and dollar value, and route to the right owner fast. Trace each denial to its origin — front end, coding, or payer — and quantify recurring drivers. Correct, document, and resubmit within filing limits using payer specific appeal templates. Feed root cause findings upstream to fix the process and stop repeat denials. Close the loop: the biggest wins come from prevention — every root cause fixed upstream is a denial that never recurs. Present this as a closed loop, not a queue of problems. Step 1, identify and triage: capture every denial, categorize by reason code and dollar value, route to the right owner fast. Step 2, analyze root cause: trace each denial to its origin front end, coding, or payer and quantify recurring drivers. Step 3, appeal and rework: correct, document, and resubmit within filing limits using payer specific templates. Step 4, prevent and improve: feed findings upstream so the process changes. Emphasize the loop closing the biggest wins come from prevention, not from faster appeals..
Scene 18 (20m 58s)
[Audio] Best Practices Preventing Denials at the Source Because the majority of denials begin at the front end, prevention pays back faster than any appeal. Empower Front End Staff Automate Verification Track Denials by Root Cause Train and equip registration and access teams to verify eligibility and authorizations right the first time. Use real time eligibility, authorization, and claim scrubbing tools to catch errors before submission. Maintain a reason code dashboard and hold weekly cross team reviews on top drivers. Standardize Appeals Break Down Silos Monitor Payer Performance Build payer specific templates and clear ownership so nothing misses a filing deadline. Align access, Him, coding, and billing around shared denial goals — not blame. Score payers on denial and turnaround trends to target negotiations and follow up. Six practices, and the logic is simple: because most denials begin at the front end, prevention pays back faster than any appeal. Empower front end staff to verify eligibility and authorizations right the first time. Automate verification with real time eligibility, authorization, and claim scrubbing tools. Track denials by root cause with a reason code dashboard and weekly cross team reviews. Standardize appeals with payer specific templates and clear ownership so no filing deadline is missed. Break down silos between access, Him, coding, and billing shared goals, not blame. Monitor payer performance to target negotiations and follow up..
Scene 19 (22m 47s)
[Audio] Looking Ahead Automation & A-I in the Revenue Cycle 86% of health systems already use A-I in some form across their revenue cycle operations. Predictive Denial Prevention Flag claims likely to deny before submission and auto correct. Autonomous & Assisted Coding A-I suggests and validates codes to lift accuracy and speed. Automated Eligibility & Prior Auth Automation frees teams to focus on the complex exceptions where human judgment recovers the most revenue. Bots verify coverage and initiate authorizations in real time. Shift from Hiring to Automating Redeploy staff from repetitive tasks to high value exceptions. Looking ahead: 86% of health systems already use A-I somewhere in revenue cycle operations. Predictive denial prevention flags claims likely to deny before submission and auto corrects. Autonomous and assisted coding suggests and validates codes to lift accuracy and speed. Automated eligibility and prior auth bots verify coverage and initiate authorizations in real time. The staffing shift: redeploy people from repetitive tasks to high value exceptions. Reassuring framing: automation handles volume so humans handle the complex cases where judgment recovers the most revenue..
Scene 20 (24m 18s)
[Audio] Accountability Roles & Ownership Across the Cycle The cycle only works when every team owns its hand off — one shared scoreboard, not a blame game. Patient Access Him, 401 & Coding Billing & P-F-S Front Office Mid cycle Back end Owns clean data at intake Owns claim integrity Owns cash realization Registration & demographics Eligibility & authorization Estimates & P-O-S collections Documentation & 401 queries Accurate coding & modifiers Charge capture & scrubbing Claim submission & posting Denial management & appeals A/R follow up & collections Watch Watch Watch Registration accuracy · P-O-S cash Coding accuracy · Clean claim rate Days in A/R · Net collection rate One scoreboard: denials and A/R days are shared outcomes — every team's hand off shows up in someone else's numbers. Accountability slide the cycle only works when every team owns its hand off. Patient Access owns clean data at intake: registration and demographics, eligibility and authorization, estimates and point of service collections. Watch registration accuracy and P-O-S cash. Him, 401 and Coding own claim integrity: documentation and 401 queries, accurate coding and modifiers, charge capture and scrubbing. Watch coding accuracy and clean claim rate. Billing and P-F-S own cash realization: claim submission and posting, denial management and appeals, A/R follow up and collections. Watch Days in A/R and net collection rate. Close with the shared scoreboard idea: denials and A/R days are shared outcomes every hand off shows up in someone else's numbers..
Scene 21 (26m 22s)
[Audio] Rising Patient Responsibility The Patient Financial Experience Transparent Upfront Estimates Why It Matters Now Give clear cost estimates before service so there are no billing surprises. Patients are the new payer Point of Service Collections Request copays and balances at check in, when patients are most likely to pay. Rising deductibles and copays push a growing share of revenue directly onto patients. Balances are harder to collect once the patient leaves — timing and clarity are everything. A confusing bill erodes both cash flow and patient trust in the organization. Digital, Flexible Payments Offer online portals, mobile pay, and payment plans that fit patient budgets. Clear, Consolidated Statements Send simple, itemized bills with a single balance and obvious next steps. Proactive Financial Counseling Screen early for assistance and set up plans to prevent bad debt. Context: rising deductibles and copays push a growing share of revenue directly onto patients patients are effectively the new payer. Five practices: transparent upfront estimates, point of service collections, digital and flexible payments, clear consolidated statements, and proactive financial counseling. Timing matters balances are far harder to collect once the patient leaves the building. A confusing bill costs twice: it slows cash flow and erodes patient trust..
Scene 22 (28m 0s)
[Audio] From Framework to Action Your Next 90 Days Baseline your K-P-I-s Attack front end root causes Measure Days in A/R, clean claim rate, and denial rate against national benchmarks to find the biggest gaps. Tighten eligibility, authorization, and registration — where half of denials begin. Stand up a denial loop Automate the repeatable Track denials by reason code and route root cause findings back upstream weekly. Deploy real time verification and claim scrubbing; reserve staff for complex exceptions. Prevention beats recovery — fix the process once, and the revenue follows every time. Turn the framework into action with a 90-day plan. One: baseline your K-P-I's Days in A/R, clean claim rate, denial rate against national benchmarks to find the biggest gaps. Two: attack front end root causes in eligibility, authorization, and registration, where half of denials begin. Three: stand up a denial loop track by reason code and route root cause findings upstream weekly. Four: automate the repeatable with real time verification and claim scrubbing, reserving staff for complex exceptions. Closing line: prevention beats recovery fix the process once and the revenue follows every time..
Scene 23 (29m 30s)
[Audio] References Resources & Sources Used Benchmarks, workflow stages, and best practices in this deck draw on the following industry sources (2025–2026). HFMA — M-A-P Keys: Industry Standard Revenue Cycle K-P-I-s Omega Healthcare — Best Practices for Denial & Appeals Management hfma.org omegahms.com HFMA — Strategies for Proactive Denial Management & Prevention Definitive Healthcare — Revenue Cycle Management Trends hfma.org definitivehc.com McKinsey & Company — Automation, Analytics and A-I in the Revenue Cycle Conifer Health Solutions — Modernizing Revenue Cycle Management mckinsey.com coniferhealth.com Kodiak Solutions — Revenue Cycle Analytics (2026, 2300 plus hospitals) Plutus Health — RCM KPI Guide 2026: Metrics & Benchmarks kodiaksolutions.io plutushealthinc.com MGMA — DataDive Practice Benchmarks (A/R & collections) Notable Health — A-I and Automation in Revenue Cycle Management mgma.com notablehealth.com Experian Health — State of Claims Provider Survey LBMC — Revenue Cycle Management in Healthcare: 2026 Guide experian.com lbmc.com Third party benchmarks are attributed to their original publishers as cited within the sources above. U-R-L's shown are publisher domains. Reference slide benchmarks, workflow stages, and best practices draw on these 2025-2026 industry sources. Point to HFMA MAP Keys for K-P-I definitions and to Kodiak Solutions for the denial and net revenue figures cited earlier. Note that third party benchmarks are attributed to their original publishers and the U-R-L's shown are publisher domains. Offer to share the deck and sources, then open the floor for questions..