Scene 1 (0s)
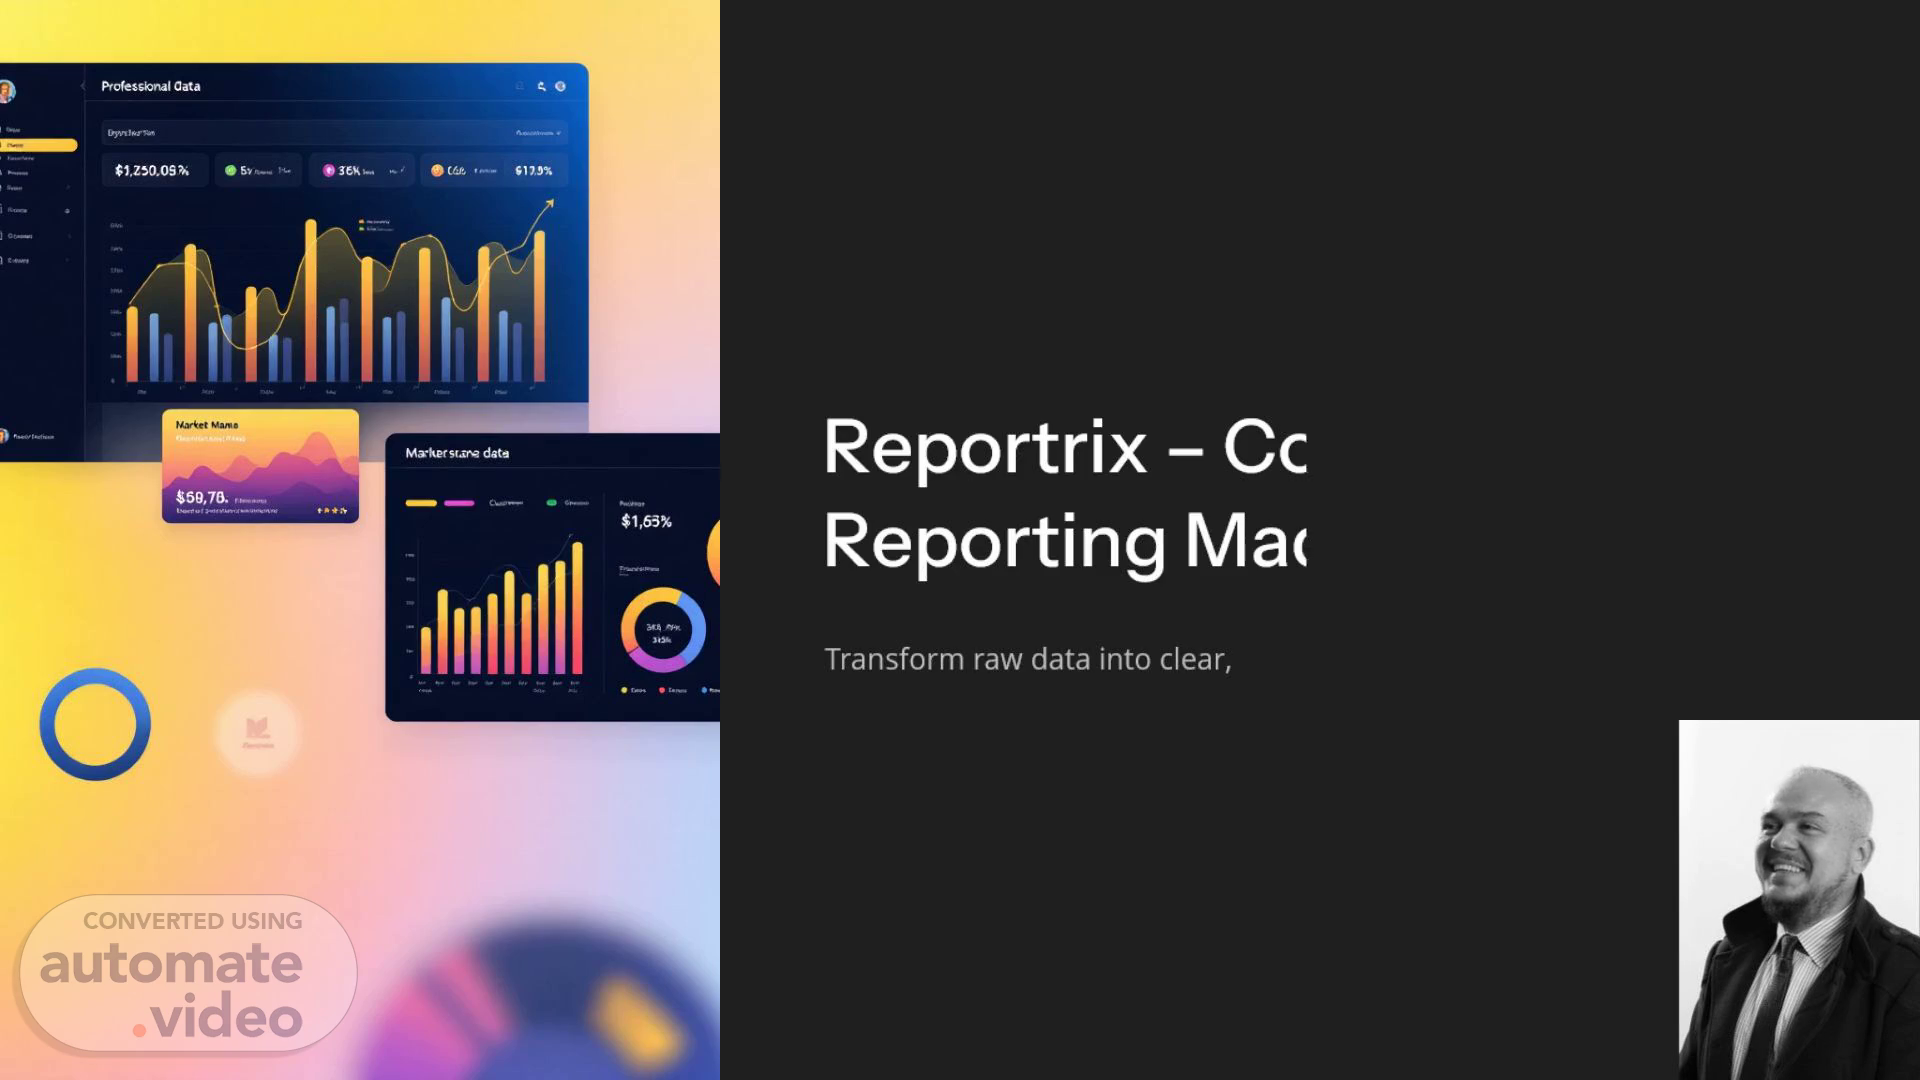
%E9'L$ mep Jay-en •OL'6S$ * sot)€zt$. Reportrix – Complex Reporting Made Simple.
Scene 2 (9s)
[Audio] With Reportrix, you can create powerful custom reports using stored procedures. This means you have complete control over the exact information you want to include in your reports. Whether it's a simple text value, a specific date range, or even multiple values, you can build exactly what you need. The drag-and-drop interface makes it easy to add dynamic parameters, such as text, dates, or single/multiple values. And when you're ready to run your report, the parameters are injected into your SQL query at runtime, giving you precise results every time..
Scene 3 (45s)
[Audio] The main goal of this project is to develop a system that can automatically classify and predict the behavior of users on social media platforms based on their online activities. The system should be able to identify patterns and trends in user behavior, such as likes, shares, comments, and other interactions with content. The system should also be able to analyze the sentiment behind these interactions, such as whether they are positive, negative, or neutral. This will enable the system to make predictions about future user behavior based on past interactions. To achieve this goal, we need to collect data from various sources, including but not limited to: social media APIs, web scraping, and user feedback forms. We also need to preprocess the collected data by cleaning, transforming, and feature engineering it to prepare it for modeling. Once the data is preprocessed, we can use machine learning algorithms to build models that can accurately classify and predict user behavior. Some possible approaches include supervised learning, unsupervised learning, and deep learning techniques. We also need to evaluate the performance of our models using metrics such as accuracy, precision, recall, F1-score, and mean squared error. This will help us determine which approach works best for our specific problem and adjust our strategy accordingly. In addition, we need to consider the ethical implications of collecting and analyzing user data, particularly when it comes to sensitive information such as personal preferences, interests, and behaviors. We must ensure that our system respects users' privacy and adheres to relevant laws and regulations..
Scene 4 (2m 32s)
[Audio] Reportrix's report management system offers advanced features for creating reports from scratch, allowing users to have complete control over the design and layout. This enables them to build complex reports tailored to their specific needs. Users can also clone existing reports, saving time and effort by duplicating successful designs. After creating or cloning a report, users can configure its settings, including assigning names and defining execution logic. For more complex scenarios, they can use Loop Mode, which enables running reports on multiple values simultaneously. This feature streamlines the workflow, making it easier to analyze large datasets and extract valuable insights. By utilizing these advanced tools, users can transform their raw data into clear, actionable reports that drive informed decision-making within their organization..
Scene 5 (3m 31s)
[Audio] Reportrix enables running identical reports across various databases through its cross-database reporting feature. This facilitates instant comparison of results, providing an all-encompassing view of the data. Intelligent column matching technology guarantees that only corresponding columns are imported, thereby eliminating redundant data and simplifying the reporting process. Furthermore, automatic compatibility detection identifies any potential problems, ensuring smooth integration with the database. By utilizing these advanced import features, time and effort can be saved while maintaining data precision and uniformity..
Scene 6 (4m 16s)
[Audio] This interactive data visualization module offers several tools to effectively explore and understand complex data sets. A tabular view presents the data in a structured format, enabling easy identification of patterns and trends. Custom filters can be applied to narrow down the focus and isolate specific information. Dynamic totals provide real-time calculations, offering instant insights into the data. The pivot view allows rotation of the data to gain new perspectives, while drag-and-drop pivoting simplifies manipulation and analysis of the data. Interactive charts provide a visual representation of the findings, facilitating quick comprehension of key relationships and correlations. Templates enable saving and reusing configurations, streamlining the workflow and ensuring consistency across different projects. The ability to reload anytime allows revisiting previous analyses and building upon them. Sharing configurations with the team facilitates collaboration and knowledge transfer..
Scene 7 (5m 20s)
[Audio] Importing data from Excel with Reportrix is a straightforward process. Click to bring in your Excel data, and our system will automatically map it to the correct fields. This eliminates the need for manual mapping, allowing you to focus on analyzing your data instead of dealing with tedious tasks. By streamlining this process, we are providing you with more time to concentrate on insights and less time on formatting issues. With Reportrix, you can quickly import your Excel data and start transforming it into clear, actionable reports..
Scene 8 (5m 56s)
[Audio] With Reportrix, you can achieve expert-grade reporting capabilities, ensuring that your reports are precise and accurate. This means you can trust the insights you gain from your data. Additionally, our platform enables rapid report generation and analysis, saving you time and allowing you to respond quickly to changing circumstances. Furthermore, our intuitive interface makes it easy for anyone to master, regardless of their technical background. By joining Reportrix, you'll have access to these powerful features and more, empowering you to transform raw data into clear, actionable reports..
