OM NAVNEET THUBE FD58
Scene 1 (0s)
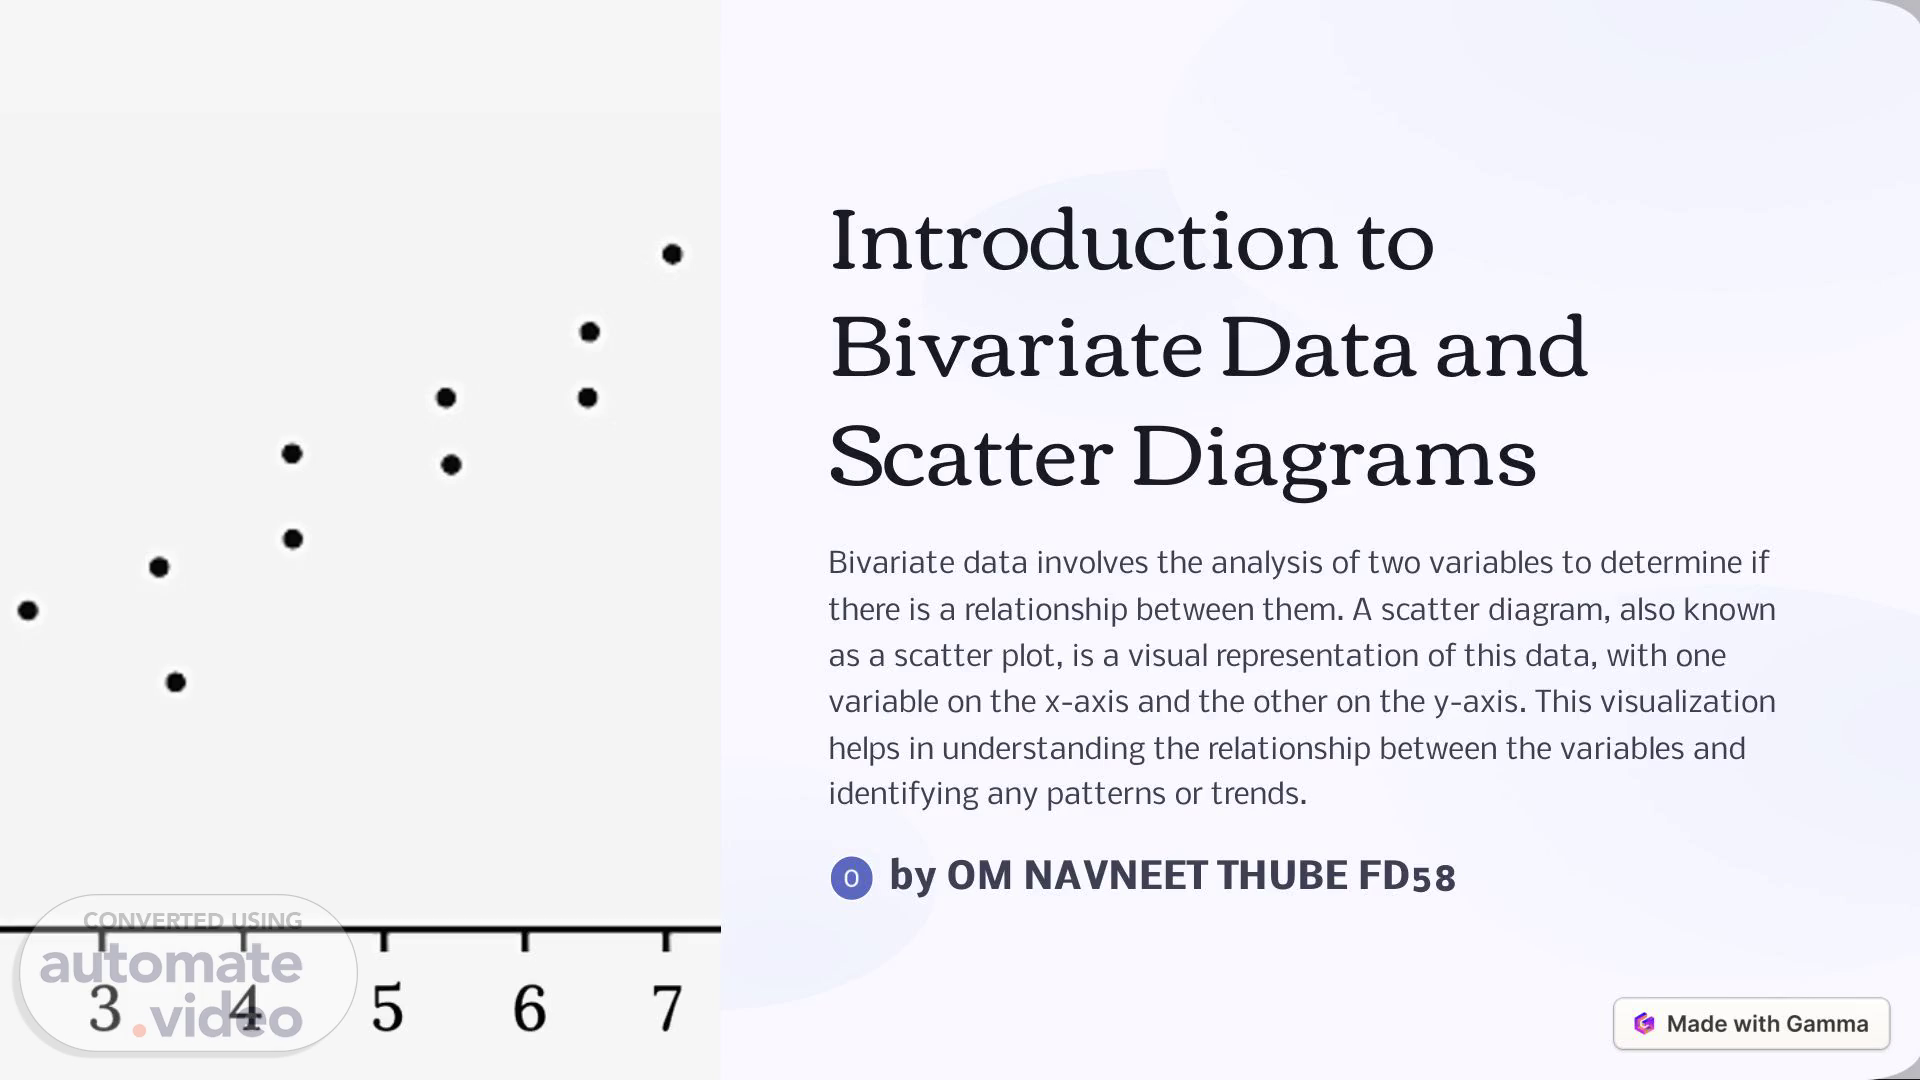
[Audio] Introduction to Bivariate Data and Scatter Diagrams Bivariate data involves the analysis of two variables to determine if there is a relationship between them. A scatter diagram, also known as a scatter plot, is a visual representation of this data, with one variable on the x-axis and the other on the y-axis. This visualization helps in understanding the relationship between the variables and identifying any patterns or trends. by OM NAVNEET THUBE FD58.
Scene 2 (32s)
[Audio] Understanding Correlation and Its Importance Positive Correlation Positive correlation indicates that as one variable increases, the other also tends to increase. Understanding this type of correlation is crucial in predicting relationships between different parameters and making informed decisions. Importance of Correlation Correlation helps in understanding the degree of relationship between two variables, which is essential in fields such as finance, economics, and scientific research..
Scene 3 (1m 4s)
[Audio] Positive Correlation and Its Characteristics Directional Relationship A positive correlation signifies a direct relationship between the two variables, where they tend to move in the same direction. Strength of Relationship The strength of a positive correlation is determined by how closely the data points cluster around a line. Real-Life Examples Examples of positive correlation include the relationship between a person's weight and their calorie intake..
Scene 4 (1m 32s)
[Audio] Negative Correlation and Its Characteristics Inverse Relationship In negative correlation, one variable tends to decrease as the other variable increases, indicating an inverse relationship. Impact on Analysis Negative correlation is crucial in scenarios like risk analysis, where understanding the inverse relationship between variables is important..
Scene 5 (1m 55s)
[Audio] No Correlation and Its Characteristics 1 Random Distribution In the absence of correlation, the data points are scattered randomly with no discernible pattern. 2 Independence of Variables No correlation indicates that the variables are independent of each other and do not affect one another..
Scene 6 (2m 16s)
[Audio] Examples of Each Type of Correlation Using Scatter Diagrams 1 Positive Correlation Example An example could be the relationship between the number of hours studied and exam scores, where higher study hours lead to higher scores. 2 Negative Correlation Example An example could be the relationship between outdoor temperature and hot chocolate sales, where higher temperatures lead to lower sales. 3 No Correlation Example An example could be the relationship between shoe size and academic performance, where no correlation is expected..
Scene 7 (2m 55s)
[Audio] Interpreting Correlation Coefficients 1 Understanding Range The correlation coefficient ranges from -1 to 1, where -1 indicates a perfect negative correlation, 1 indicates a perfect positive correlation, and 0 indicates no correlation. 2 Strength of Correlation The value of the correlation coefficient indicates the strength of the relationship between the variables, with values closer to -1 or 1 signifying a stronger correlation. 3 Statistical Significance Interpreting the p-value alongside the correlation coefficient helps determine if the relationship is statistically significant..
Scene 8 (3m 37s)
[Audio] Conclusion and Key Takeaways Decision-Making Insights Understanding correlation and bivariate data provides valuable insights for making data-driven decisions in various fields. Data Analysis Accuracy Proper interpretation of correlation contributes to accurate data analysis, leading to informed conclusions and predictions. Scope of Application The concepts of correlation and scatter diagrams have wide applications in fields such as finance, healthcare, sociology, and more..