Scene 1 (0s)
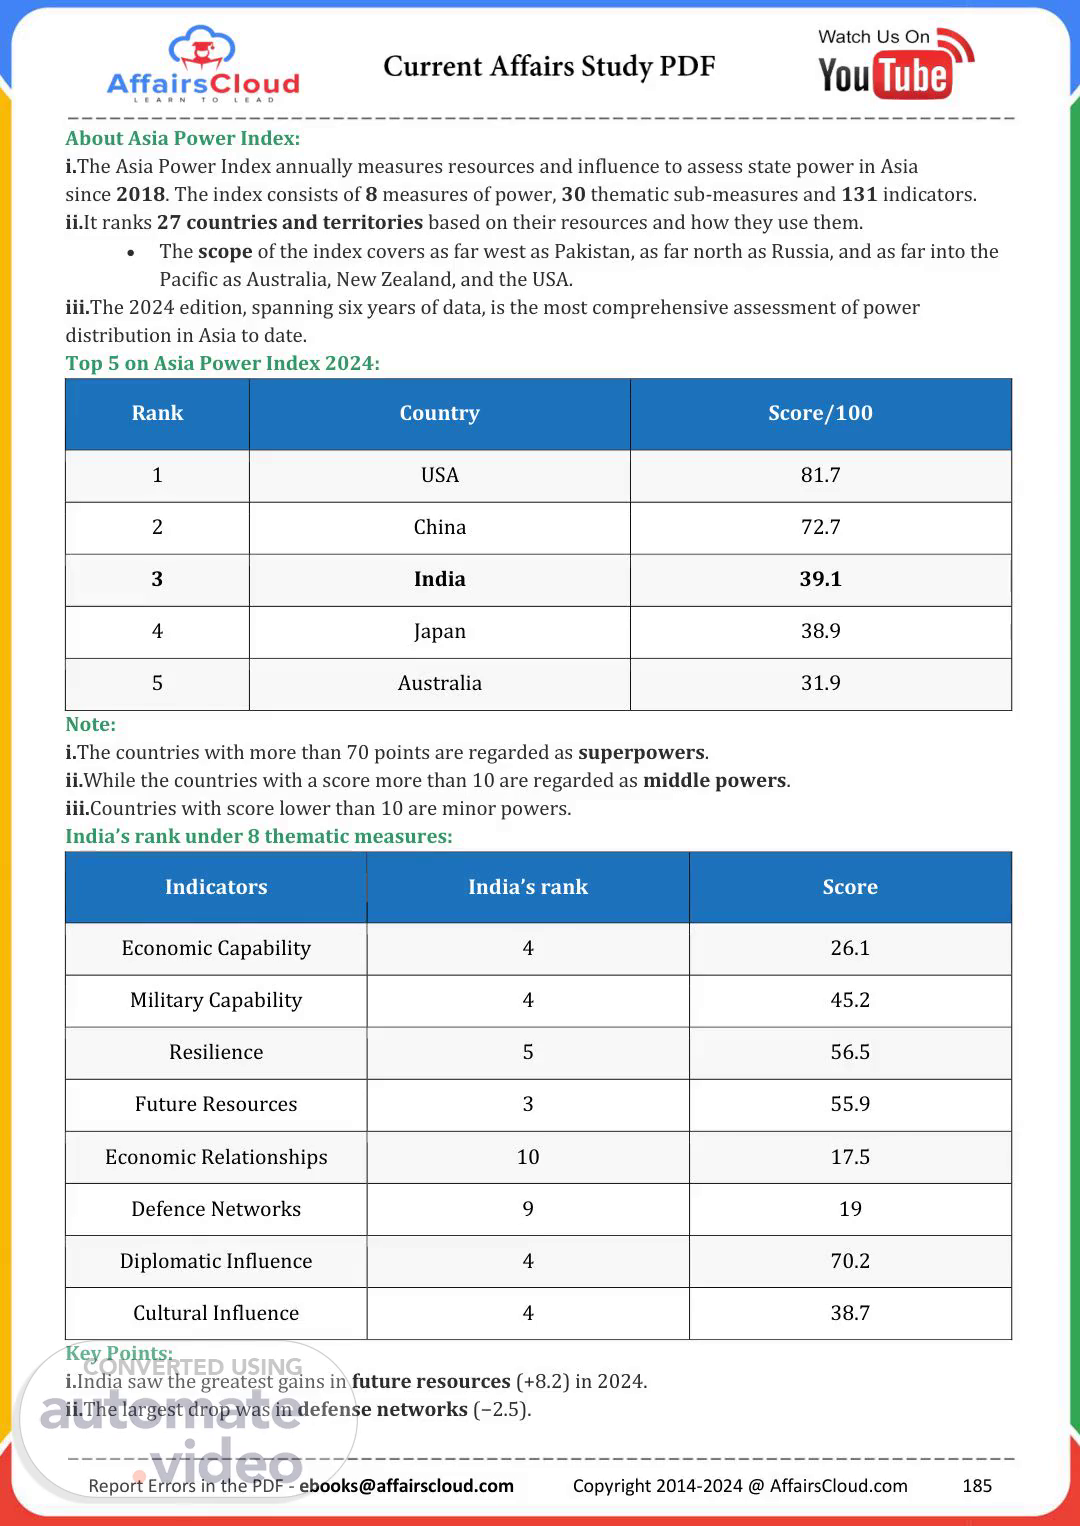
[Virtual Presenter] About Asia Power Index: i.The Asia Power Index annually measures resources and influence to assess state power in Asia since 2018. The index consists of 8 measures of power, 30 thematic sub-measures and 131 indicators. ii.It ranks 27 countries and territories based on their resources and how they use them. The scope of the index covers as far west as Pakistan, as far north as Russia, and as far into the Pacific as Australia, New Zealand, and the USA. iii.The 2024 edition, spanning six years of data, is the most comprehensive assessment of power distribution in Asia to date. Top 5 on Asia Power Index 2024: Rank Country Score/100 1 USA 81.7 2 China 72.7 3 India 39.1 4 Japan 38.9 5 Australia 31.9 Note: i.The countries with more than 70 points are regarded as superpowers. ii.While the countries with a score more than 10 are regarded as middle powers. iii.Countries with score lower than 10 are minor powers. India’s rank under 8 thematic measures: Indicators India’s rank Score Economic Capability 4 26.1 Military Capability 4 45.2 Resilience 5 56.5 Future Resources 3 55.9 Economic Relationships 10 17.5 Defence Networks 9 19 Diplomatic Influence 4 70.2 Cultural Influence 4 38.7 Key Points: i.India saw the greatest gains in future resources (+8.2) in 2024. ii.The largest drop was in defense networks (−2.5). Report Errors in the PDF - [email protected] Copyright 2014-2024 @ AffairsCloud.com 185.
Scene 2 (2m 25s)
[Audio] iii.Improvements were made in resilience (+5.2), diplomatic influence (+4.5), economic capability (+4.2), economic relationships (+2.1), and military capability (+1.1). iv.Cultural influence remained unchanged. v.India's lowest-ranked measure is economic relationships, as it is outside the regional economic integration agenda. vi.India's score improved across resource measures in 2024, but it did not gain a ranking in any category. vii.It dropped one rank in economic relationships and defense networks to 10th and 9th, respectively. viii.India's large population and Gross Domestic Product (GDP) growth solidify its position as the world's third-largest economy in PPP (Purchasing Power Parity) terms. ix.Participation in dialogues and leadership in the Quad strengthen India's role in regional security, despite being outside formal military alliances. Recent Related News: i.Uttarakhand became the first state in the world to launch a Gross Environmental Product (GEP) index to assess the overall development of the ecosystem. ii.The United Nations Educational, Scientific and Cultural Organization (UNESCO) announced the New World Soil Health Index at an International Conference on Soils in Agadir, Morocco to establish global standards for soil quality assessment. About Lowy Institute: Chairman of the Board– Sir Frank Lowy AC Headquarters– Sydney, Australia India ranked 39th in Global Innovation Index 2024; Switzerland Tops for 14th Consecutive Year According to the World Intellectual Property Organization's (WIPO) report titled 17th edition of the 'Global Innovation Index (GII – 2024)– Unlocking the Promise of Social Entrepreneurship', India secured the 39th position out of a total of 133 economies with a score of 38.3. In GII 2023, India's rank was 40th with a score of 38.1. The index has been topped by Switzerland for the 14th consecutive year. It is followed by Sweden at 2nd rank and the United States of America (USA) at 3rd. About Global Innovation Index(GII): The GII has been co-published annually since 2007 by the World Intellectual Property Organization (WIPO), INSEAD( Paris, France), Cornell University( New York, the United States of America, USA). i.It ranks the world economies according to their innovation capabilities on the basis of 80 indicators. ii.It uses 7 criteria: Institutions, Human Capital and Research, Infrastructure, Market Sophistication, Business Sophistication, Knowledge and Technology Outputs, and Creative Outputs. iii.The GII has two sub-indices: the Innovation Input Sub-Index(5 pillars) and the Innovation Output SubIndex( 2 pillars). iv.It serves as a key resource for policymakers and business leaders, tracking global innovation trends to foster human ingenuity and tackle challenges like climate change. Highlights of GII 2024: i.China reached the 11th position and remains the only middle-income economy in the GII top 30. ii.India, the Republic of Moldova and Vietnam are all innovation overperformers for 14 years in a row. iii.Saudi Arabia, Qatar, Brazil, Indonesia, Mauritius and Pakistan have climbed most in the GII (in order of their ranking). iv.Indonesia, Pakistan and Uzbekistan maintain their overperformer status for a third year and Brazil for a fourth consecutive year. Report Errors in the PDF - [email protected].
Scene 3 (6m 54s)
[Audio] v.Europe still hosts the highest number of innovation leaders among the top 25 – 15 in total, with seven among the top 10. vi.China, India, Indonesia, Iran, the Philippines, Turkey, Vietnam, and Morocco are the middle-income countries in the top 70 of the GII that have made the most significant progress in the rankings since 2013. Top 5 Countries in GII 2024: Ranking Country Score 1 Switzerland 67.5 2 Sweden 64.5 3 USA 62.4 4 Singapore 61.2 5 United Kingdom (UK) 61.0 39 India 38.3 The Lowest ranked economies are Angola, Niger, and Mali at 133rd, 132nd, and 131st positions respectively. India's Scorecard: Indicators Score Rank Institutions 51.5 54 Human Capital 34.8 51 Infrastructure 39 72 Market Sophistication 52.3 23 Business Sophistication 28.1 58 Knowledge and Technology Outputs 38.8 22 Creative Outputs 32.1 43 Key Points: i.India remains the top innovation economy in the Central and Southern Asian region. ii.India ranks 1st in lower-middle-income group, and outperformed innovation for the 14th consecutive year. iii.India also ranked 4th in the World Intellectual Property Organization (WIPO) Science & Technology (S&T) Cluster Ranking. Report Errors in the PDF - [email protected] Copyright 2014-2024 @ AffairsCloud.com 187.
Scene 4 (9m 5s)
[Audio] Mumbai,Maharashtra(Ranked 56th), Delhi(63rd), Bengaluru, Karnataka(82nd), and Chennai, Tamil Nadu(84th) are listed among the World's Top 100 S&T clusters. It is topped by Tokyo– Yokohama (Japan). iv.India is 7th globally in intangible asset intensity and India's unicorn companies also secure the country the 8th rank globally. v.India improved its rank and score in Infrastructure and Creative Outputs compared to GII 2023 but declined in Human Capital & Research, Market Sophistication, and Business Sophistication indicators. vi.India's score under the Institutions parameter dropped from 53.9 to 51.5, but the rank improved slightly from 56 to 54. vii.Under Knowledge and Technology Outputs, India's rank stayed at 22, though the score decreased from 39.7 to 38.8. viii.India's rise in the GII highlights its progress and potential as a global innovation hub. Initiatives like Start-Up India, Digital India, and the Atal Innovation Mission(AIM) have promoted entrepreneurship, research, and technological advancement. Recent Related News: i.Discipline Science and Processes (DSP) Mutual Fund has launched India's first-ever Nifty Top 10 Equal Weight Index Fund and its corresponding Exchange Traded Funds (ETFs) with the aim to provide investors with exposure to the top 10 companies listed on the Nifty Index, with each stock receiving equal weight in the portfolio. ii.According to the Brand Finance's Food & Drink 2024 report, Anand Milk Union Limited (AMUL) has emerged as the world's strongest food and dairy brand with an AAA+ rating for the 4th consecutive year. The brand value of AMUL has increased by 11% to USD 3.3 billion, with a Brand Strength Index (BSI) score of 91 out of 100. About World Intellectual Property Organization (WIPO): It is the global forum for Intellectual Property (IP) services, policy, information and cooperation with 193 member states (as of October 1, 2024). Director General– Daren Tang Headquarters– Geneva, Switzerland Establishment– 1967 IMD World Talent Ranking 2024: Switzerland leads, India Slips to 58th Spot According to Switzerland based Institute for Management Development (IMD)'s 'World Talent Ranking (WTR) 2024: The Socio-Economic Implications of AI in the Workplace', Switzerland has topped the list as the world's most competitive country for the 11th consecutive year, with an overall score of 100. Switzerland has performed well in investment, development, and appeal factors, while ranking high in quality of life, health infrastructure, educational attainment, among others. As per the report, India's ranking at 2024 IMD WTR has dropped by 2 places, from 56th position (in 2023) to 58th position (in 2024), with overall score of 40.7. World Talent Ranking 2024: i.It is the 11th edition of IMD WTR and has covered 67 economies. It is published by the IMD World Competitiveness Center (WCC). ii.It evaluates the performance of nations based on their ability to develop, retain, and attract highly qualified domestic and international talent. iii.It defines talent competitiveness into 3 main factors: Investment and Development factor: It measures the resources earmarked to cultivate a homegrown.
Scene 5 (13m 49s)
[Audio] Readiness factor: It measures the quality of the skills and competencies that are available in a country's talent pool. iv.The report cautioned that Artificial Intelligence (AI) adoption could be detrimental to the attraction and retention of talent, and to quality-of-life levels in certain economies, which could hinder their long-term talent competitiveness. Top 5 Countries: Rank Country Overall Score 1 Switzerland 100 2 Singapore 85.65 3 Luxembourg 81.69 4 Sweden 81.02 5 Denmark 78.49 58 India 40.47 Key Findings: i.Singapore has made into the top 3 countries for the 1st time since the inception of WTR in 2014. It has improved its ranking significantly from 18th spot (in 2014) to 2nd (in 2024). This improvement is mainly driven by Singapore's exceptional talent pool, characterized by low discrimination and a robust availability of skilled labour and financial expertise. It has also jumped by 6 places in the latest ranking, from 8th position in 2023. ii.Luxembourg has witnessed a marginal drop in its ranking compared to previous year i.e. from 2nd position (in 2023) to 3rd (in 2024). While Sweden has secured 4th position in the latest rankings with an overall score of 81.02 (up from 10th spot in 2023), followed by Denmark which has moved from 7th spot (in 2023) to 5th (in 2024). iii.Among the top 10 countries in 2024 WTR, 8 countries are from the European region, with Switzerland leading the ranking, excelling in talent competitiveness. The remaining two countries in the top 10 are from the Asian region: Singapore and Hong Kong Special Administrative Region (SAR) of China ranked 9th position as the most competitive economies for talent. iv.The United States of America (USA) has dropped from 6th position to 21st position with an overall score of 66.84. This drop in ranking is mainly attributed by its poor performance in appeal (ranked at 14th) and readiness categories (ranked at 32nd) due to factors like cost of living and personal income tax rates. v.According to the report, 3 new countries which have debuted in the WTR 2024 are: Ghana (64th), Nigeria (60th) and Puerto Rico (45th). vi.The Slovak Republic (59th), Colombia (60th), Mexico (61st), Mongolia (62nd), and Venezuela (63rd) are at the bottom of the ranking. India-Specific: i.The 2024 WTR showed a mixed performance for India compared to previous years as the overall rank of India has dropped from 52nd (in 2022) to 58th (in 2024). Report Errors in the PDF - [email protected] Copyright 2014-2024 @ AffairsCloud.com 189.
Scene 6 (17m 42s)
[Audio] ii.India's performance in the appeal category has remained stable compared to previous year and was ranked at 53rd position in 2024. iii.While, India's ranking in the readiness and investment & development category has decreased significantly. Its ranking in readiness category has decreased from 18 (in 2022) to 35 (in 2024). Similarly, India's ranking in investment and development decreased from 61 (in 2022) to 66 (in 2024). iv.India has secured 12th position among Asia-Pacific countries in 2024 IMD WTR. About the International Institute for Management Development (IMD): President– David Bach Headquarters– Lausanne, Switzerland EFW 2024 Annual Report: Hong Kong Regains Title as World's Largest Freest Economy from Singapore & India ranked 84 According to the Vancouver (Canada)-based public policy research organisation Fraser Institute's latest report titled "Economic Freedom of the World (EFW) 2024 Annual Report, Hong Kong Special Administrative Region (SAR), People's Republic of China, with ratings of 8.58, has reclaimed title as the world's largest freest economy from Singapore, which has been ranked at 2nd position with overall score of 8.55. In EFW 2023, Hong Kong dropped from 1st position to 2nd position for the 1st time since the inception of the EFW index in 1970. India has improved its ranking by 3 places, from 87th (In EFW 2023) to 84th (in EFW 2024) with the overall ratings of 6.58. Switzerland ranked at 3rd position with an overall score of 8.43, followed by New Zealand (with ratings of 8.39), the United States of America (USA) (with ratings of 8.09), ranked at 4th and 5th position respectively. About EFW 2024 Annual Report: i.This latest edition of EFW index is based on data from 2022, the most recent year with comparable statistics across 165 jurisdictions. ii.The EFW index is developed to measure the degree to which institutions and policies of the countries allow people to make their own economic choices. iii.The report has used 45 data points, which are further organised into 5 main areas such as: size of the government, legal system and property rights, sound money, freedom to trade internationally, and regulation. It has also used a Gender Legal Rights Adjustment to assess for the extent to which women have different levels of economic freedom compared to the men. iv.Most of the data in EFW index received from external sources such as the International Monetary Fund (IMF), the World Bank Group , or the World Economic Forum (WEF). Top 5 Countries in 2024 EFW Annual Report: Rank Country Overall Ratings Hong Kong 1 Special Administrative Region (SAR), 8.58 People's Republic of China 2 Singapore 8.55 Report Errors in the PDF - [email protected] Copyright 2014-2024 @ AffairsCloud.com 190.
Scene 7 (21m 37s)
[Audio] 3 Switzerland 8.43 4 New Zealand 8.39 5 The United States of America (USA) 8.09 84 India 6.58 Key Highlights: i.According to the report, the global average economic freedom ratings for all jurisdictions increased from 6.19 to 6.80 between 2000 and 2019. However, the global economic freedom had decreased to 6.56 in 2022, reversing more than a decade of progress. Globally, economic freedom declined for a third straight year after more than a decade of gains. ii.Among the 5 main areas of the EFW index, Hong Kong ranked at 1st spot in "freedom to trade internationally" and "regulation". While, it placed at 3rd spot globally for "sound money", 21st for "legal system and property rights" and 45th in "size of the government". iii.Denmark and Ireland (tied at 6th position), Canada (8th ), Australia and Luxembourg (tied at 9th position) are among the top 10 highest scoring nations. iv.Rankings of other major economies: Japan (11th), Germany (16th), Taiwan (19th), Korea (32nd), France (36th), Italy (5th), Mexico (65th), among others. v.Venezuela with the ratings of 3.02, ranked lowest in the rankings, followed by Zimbabwe (3.53),Sudan (4.11), Syrian Arab Republic (4.28) and Algeria (4.46) ranked at 164th, 163rd , 162nd and 161st position respectively. Other Bottom 5 Countries: Myanmar (160th), Argentina (159th), Iran (158th), Libya (157th) and Yemen (156th). vi.The report highlighted the two largest declines in ratings between 2021 and 2022 were Ukraine (0.94) and Moldova (-0.63). Both these nations have either been invaded (Ukraine) or threatened militarily(Moldova) by Russia. India-Specific: i.India(84th) ranked second highest among BRICS nations i.e. Brazil (85th), Russia (119th), China (104th) and South Africa (81st). Note: BRICS is an acronym of 5 major emerging economies namely, Brazil, Russia, India, China and South Africa. ii.India ranked at 25th position in size of the government area, with ratings of 7.73. India secured 71st position and 87th position in Legal System and Property Rights (ratings of 5.29), Sound Money (ratings of 7.51) respectively. iii.India performed worse in two areas of the EFW index: in "Regulation" area ranked at 102nd position (with ratings of 6.17) and in "Freedom to Trade Internationally" ranked at 126th position with ratings of 6.18. Other Key Findings: i.As per the report, 1% of the population in the most economically free places experiences extreme poverty (living on less than USD 2.15 per day), while for the least-free places, 30% of the population experiences extreme poverty. ii.In least economically-free countries, the infant mortality rate is 9 times greater than in the freest places. iii.The report observed that people in the freest places reported about 40% more satisfaction with their lives compared to people living in least economically-free places. Report Errors in the PDF - [email protected] Copyright 2014-2024 @ AffairsCloud.com 191.
Scene 8 (26m 28s)
[Audio] iv.The report highlighted that the freest places score more than 50% better on the Environment Performance Index (EPI), which ranks the countries based on climate change performance, environmental health, compared with least economically free places. v.As per the report, among the jurisdictions in the top quartile of economic freedom, Gross Domestic Product (GDP) per person was USD 52,877 in 2022, while GDP per person in the least economically free places was USD 6,968. REPORTS Fossil Fuel Dominance in Electricity Generation to end by 2030: RBI report The Reserve Bank of India (RBI), in its latest report, forecasts that the dominance of fossil fuels in India's electricity generation will end by 2030, with renewable energy expected to surpass 50% of global electricity generation. This transition is seen as critical for achieving sustainability goals and addressing climate challenges. Key Points: i.The rise of cleaner power generation will address "hard-to-abate" sectors like steelmaking and aviation, where low-carbon alternatives are still emerging. ii.The RBI emphasized the need for increased investment in low-carbon energy, for every United States Dollar(USD) that goes to fossil fuels, an average of USD 3 needs to be invested in low-carbon energy over the remainder of the decade. iii.Tripling renewable energy capacity by 2030 is crucial to meeting global net-zero emission targets by mid-century. iv.A fully decarbonized global energy system by 2050 is estimated to cost USD 215 trillion. v.The report stressed the importance of balancing public policy interventions and market-based competition to ensure a successful energy transition. Total Employment in Manufacturing Industries up 7.5% in FY23: ASI by MoSPI The Annual Survey of Industries (ASI) conducted by the Ministry of Statistics and Programme Implementation (MoSPI) revealed that total employment in manufacturing industries rose by 7.5% in the Financial Year 2022-2023 (FY23), reaching 1.85 crore from 1.72 crore in FY 2021-22 (FY22). The survey's fieldwork occurred between November 2023 and June 2024, covering the FY April 2022 to March 2023. Highlights w.r.t Manufacturing Industries: i.Employment in manufacturing exceeded pre-pandemic levels (2018-19) by 22.14 lakh. ii.Average emoluments per person increased by 6.3% compared to FY22. iii.Total employment grew from 1,72,15,350 in FY22 to 1,84,94,962 in FY23, with prior years' figures being 1,60,89,700 (FY21), 1,66,24,291 (FY20), and 1,62,80,211 (FY19). iv.Gross Value Added (GVA) in current prices grew by 7.3% over FY22. v.Inputs rose by 24.4%, while output increased by 21.5% in FY23. vi.Key growth industries included basic metals, refined petroleum, food products, chemicals, and motor vehicles, contributing 58% to total output. vii.The top five states by GVA in FY23 were Maharashtra at 1st, followed by Gujarat, Tamil Nadu (TN), Karnataka, and Uttar Pradesh (UP) at 2nd, 3rd, 4th, and 5th respectively, accounting for 54% of total manufacturing GVA. viii.The same states employed 55% of the manufacturing workforce in FY23 viz. TN at 1st, followed by Maharashtra, Gujarat, UP, and Karnataka. Report Errors in the PDF - [email protected].
Scene 9 (31m 28s)
[Audio] ix.Fixed capital rose to Rs 41,21,794.58 crore in FY23 from Rs 37,26,354.44 crore in FY22, and invested capital to Rs 61,39,212.55 crore in FY23 from Rs 55,44,931.75 crore in FY22. Key Statistics: Year FY23 FY22 Fixed Capital 41,21,79,458 37,26,35,444 Invested Capital 61,39,21,255 55,44,93,175 Total Persons Engaged (No.) 1,84,94,962 1,72,15,350 Total Emoluments 6,40,49,070 5,60,82,801 GVA 21,97,05,605 20,47,97,151 Top 5 States by GVA: Rank State 1 Maharashtra (16.33%) 2 Gujarat (14.78%) 3 Tamil Nadu (TN) (10.33%) 4 Karnataka (7.04%) 5 Uttar Pradesh (UP) (6.09%) Click Here for Official Data About ASI: It aims to provide insights into the dynamics of manufacturing industries, focusing on changes in composition, growth, and structure related to output, value added, employment, and capital formation. It serves as a vital resource for National Accounts Statistics at both national and state levels. From 2010-11 (FY11), the survey was conducted annually under the Collection of Statistics (COS) Act, 2008, and its 2011 rules, except in Jammu & Kashmir, where it follows the J&K Collection of Statistics Act, 2010, and its 2012 rules. About Ministry of Statistics and Programme Implementation (MoSPI): Minister of State (Independent Charge)– Rao Inderjit Singh (Constituency- Gurugram,Haryana) Headquarters– New Delhi, Delhi Unemployment Benefits and Coverage Lag in Asia-Pacific: ILO report The International Labour Organisation's (ILO) report, 'World Social Protection Report 2024-26 : Regional companion report for Asia and the Pacific', highlights significant challenges in extending unemployment benefits in Asia-Pacific. The Asia-Pacific region has achieved a 53.6% coverage, for the first time, of its population by at least one social protection benefit, but it spends only 11.8% of Gross Domestic Product (GDP) on social protection, below the global average of 19.3%. Report Errors in the PDF - [email protected] Copyright 2014-2024 @ AffairsCloud.com 193.
Scene 10 (36m 16s)
[Audio] Key Findings: i.About 2.1 billion people remain unprotected from lifecycle and socio-economic risks, with uneven progress in social protection. ii.Social protection systems must be strengthened to address climate change impacts. iii.Coverage rates have improved since 2015 in various regions, with eastern Asia seeing the highest increase by 15.2% points (from 63.3 to 78.5%), 13.4 % points (32.5 to 45.9%) in south-eastern Asia; 16.7% points (18.7 to 35.4%) in southern Asia; 6.8% points (65.7 to 72.5%) in the Pacific Islands. iv.The coverage rates vary widely among populous countries, with India at 48.4%, 75.6% in China and 20.2% in Bangladesh. v.There's a gender gap in effective coverage, with women receiving 6.8 % points less than men. In Southern Asia, there is 11.1%-point gap. Indian Scenario: In India, the child food program covers 51.9% of children, contributing to higher effective coverage in southern Asia. However, unemployment insurance only legally covers 11.5% of the working-age population, and reaching informal sector workers remains a major challenge. India Ranked 105th in Global Hunger Index 2024, Placed under "Serious" Category According to the 19th edition of 'Global Hunger Index (GHI 2024): How Gender Justice Can Advance Climate Resilience and Zero Hunger', India has been ranked at 105th position among 127 countries with an overall score of 27.3. India has improved its ranking by 6 places, from 111th (2023). As per the report, India is among 42 countries that have been placed under the "serious" category for hunger levels, alongside Pakistan (109th) and Afghanistan (116th). While, other South Asian neighbours of India such as Bangladesh (84th), Nepal (68th) and Sri Lanka (56th) demonstrated better GHI scores were listed under the "moderate" category. About GHI: i.The Global Hunger Index (GHI) is a tool used by international humanitarian agencies to measure and track hunger levels with GHI scores based on under-nourishment and child mortality indicators across 127 countries. ii.The GHI is published by Irish humanitarian organisation Concern Worldwide and German aide agency Welthungerhilfe (WHH), with an aim to trigger action to reduce hunger around the world. Highlights : i.The report highlighted that global progress in reducing hunger has stagnated since 2016, thus, making the chances of achieving the United Nations (UN) Sustainable Development Goal (SDG) of Zero Hunger by 2030 increasingly unlikely. ii.As per the report, around 733 million people face hunger each day due to lack of access to a sufficient amount of food, while about 2.8 billion people cannot afford a healthy diet. It highlighted that some of the African nations are on the extreme ends of the GHI spectrum under the "alarming" category. It outlined that wars in Gaza and Sudan have led to exceptional food crises. Also, conflict and civil strife are generating food crises elsewhere including the Democratic Republic of the Congo, Haiti, Mali and Syria. Methodology: i.GHI is based on the values of 4 key indicators that together capture the multi-dimensional nature of hunger which includes: Undernourishment: It is the share.
Scene 11 (40m 59s)
[Audio] Child stunting: It is the share of children under the age of 5 who have low height for their age due to "chronic" undernutrition. Child wasting: It is the share of children under the age of 5 who have low weight for their height due to "acute" undernutrition. Child mortality: It is the share of children who pass away before turning 5, which partly reflects the fatal mix of poor nutrition and unsafe environments. ii.A GHI score is calculated for each country on a 100 point scale, reflecting the severity of hunger, where zero is considered the best possible score (no hunger) and 100 is the worst (high level of hunger). iii.The share of indicators in GHI scores: undernourishment (1/3),child stunting (1/6), child wasting (1/6), and child mortality (1/3). iv.The data used for the indicators have been sourced from various United Nations (UN) and other multilateral agencies, including the United Nations Children's Fund (UNICEF), the Demographic and Health Surveys (DHS) Program, and the Food and Agriculture Organisation (FAO). Global Scenario: i.The 2024 GHI score for the world is 18.3, which is considered moderate, has decreased marginally from the 2016 GHI score of 18.8. This global score demonstrates wide variations in hunger by region. ii.As per the report, 22 countries with 2024 GHI scores of less than 5 have not been assigned individual ranks, they have been collectively ranked 1-22. Name of these 22 countries are: Belarus, Bosnia & Herzegovina, Chile, China, Costa Rica, Croatia, Estonia, Georgia, Hungary, Kuwait, Latvia, Lithuania, Montenegro, North Macedonia, Romania, Russian Federation, Serbia, Slovakia, Türkiye, the United Arab Emirates (UAE), Uruguay, Uzbekistan. iii.The report highlighted that hunger is serious or alarming in 42 countries out of 127 countries surveyed in 2024 GHI. Among these 42 countries, hunger is considered alarming in 6 countries such as: Burundi, Chad, Madagascar, Somalia, South Sudan, and Yemen. While, hunger is designated as serious in the remaining 36 countries (including India). iv.The report showed that progress against hunger in 20 countries with moderate, serious, or alarmingly 2024 GHI scores, has largely remain stagnated i.e. GHI scores of these countries have declined by less than 5% compared to their 2016 GHI scores or have not changed at all. Also, hunger in 22 countries with moderate, serious or alarming 2024 GHI scores, has increased since 2016. v.The report highlighted that 2024 GHI scores of 5 countries i.e. Fiji, Jordan, Libya, Syria, and Venezuela, are even worse compared to their 2000 GHI scores. The report noted that some small countries such as: Bangladesh, Mozambique, Nepal, Somalia, and Togo have reduced their GHI scores by more than 5% compared with their 2016 GHI scores, even if hunger in these countries remains too high. vi.Top 5 worst performing countries: Somalia (127th), Yemen (126th), Chad (125th), Madagascar (124th), Democratic Republic of Congo (123rd). India-Specific: i.The report observed that India's 2024 GHI score showed some improvement compared to its 2016 GHI score of 29.3, which also fell under the "serious" category. It noted that India has made considerable progress.
Scene 12 (45m 51s)
[Audio] iii.India has significantly improved its child mortality rate since 2000, it has decreased from 9.2% (2000) to 2.9%(2024). iv.The report noted that although the child stunting rate in India has reduced significantly from 51.0% (2000) to 35.5 %(2024), it is still alarmingly high. vi.The undernourishment rate of India has decreased from 18.3% (2000) to 13.7% (2024). Region Wise: i.According to the report, Africa South of the Sahara is the world with the highest and most concerning hunger levels. The high GHI score is mainly attributed to the highest undernourishment rate, child mortality rates of any region by far. It observed that undernourishment rate rose sharply between 2015 and 2023, particularly in West and Central Africa due to recurring conflicts, economic challenges, increasing inflation, among others. ii.The report noted that hunger remains serious in the South Asia region, reflecting undernourishment and continuously high child undernutrition, mainly due to poor diet quality, economic challenges and the increasing impacts of natural disasters. iii.Hunger in Latin America and the Caribbean region is categorised as "low". But still, it is the only region in the world where hunger has worsened since 2016, attributed mainly by rising food inflation, and fertilizer prices, increasing debt, among others. iv.While, West Asia and North Africa region has been categorised as "moderate", but the GHI score of this region has remained stagnated due to the overlapping effects of conflict, climate change, and trade shocks. The report found that despite challenges, the European and Central Asian region is mostly on track to achieve low hunger by 2030. About Welthungerhilfe (WHH): It is one of the largest private aid organisations in Germany, without political or religious affiliation. President- Marlehn Thieme Headquarters- Bonn, Germany Established- 1962 MoSPI released the 'Comprehensive Annual Modular Survey:July 2022- June 2023' The Ministry of Statistics and Programme Implementation (MoSPI) released the 'Comprehensive Annual Modular Survey (CAMS) : July 2022- June 2023'. This survey was conducted as part of the 79th round of the National Sample Survey (NSS), conducted from July 2022 to June 2023. The survey is not conducted in some of the villages in Andaman and Nicobar Islands. The main purpose of CAMS was to collect data to create indicators on important areas like education, medical expenses paid directly by people, mobile and internet use, access to financial services, Information and Communication Technology (ICT) skills, and ownership of assets. About Comprehensive Annual Modular Survey (CAMS) : i.The CAMS, a yearly survey, is introduced and designed to collect information required to generate some important Socio-Economic indicators that are not available from any other source. ii.It is conducted by the National Sample Survey Office (NSSO) under the Ministry of Statistics and Program Implementation (MoSPI). iii.This survey provided the information which was required for the purpose of monitoring the performances of Sustainable Development Goals (SDGs) indicators. It also gathered information on basic services such as drinking water, sanitation, energy use, birth registration, and transportation.
Scene 13 (50m 15s)
[Audio] Sampling Method: The survey used a Two-Stage Stratified Sampling method: i.First Stage Units (FSUs): In rural areas, the FSUs were villages or smaller sub-units, while in urban areas, they were blocks from the Urban Frame Survey (UFS) or sub-units. These FSUs were distributed across States and Union Territories(UT) based on the population figures from the 2011 Census. ii.Second Stage Units (SSUs): These were households selected in both rural and urban areas. iii.For both FSUs and SSUs, a method called Simple Random Sampling Without Replacement (SRSWOR) was used to ensure that each unit had an equal chance of being selected, without repeating any unit. Key Findings: i.In rural areas, approximately 96.5% of individuals aged 15-24 years can read and write simple statements in their everyday lives and perform basic arithmetic calculations. In urban areas, this figure is around 97.9%. For individuals aged 15-29 years, the percentages are 95.3% in rural areas and 97.4% in urban areas, with an overall figure of 95.9%. For those aged 15 years and above, the percentages are 77.3% in rural areas, 90% in urban areas, and an overall average of 81.2%. The average number of years of formal education for people aged 15 and older in India is 8.4 years. For those who are 25 and older, this average drops to 7.5 years. iii.In terms of medical expenses, households in rural areas spent an average of Rs 4,129 on hospitalization over the past year, while urban households spent Rs 5,290. For non-hospitalized medical treatment in the last 30 days, rural households had an average expense of Rs 539, and urban households spent about Rs 606. Other key indicators: i.The survey reveals significant insights into literacy, education, and infrastructure across rural and urban India. Among individuals aged 15-24, literacy rates stand at 96.7% in rural areas and 98.0% in urban areas, resulting in an overall literacy rate of 97.0%. For children, aged enrollment in primary education is 90.5% in rural areas and 89.2% in urban settings. Among those aged 25 and above, 30.4% of rural and 56.6% of urban individuals have completed secondary education. ii.In terms of youth participation, 45.9% in rural areas and 57.1% in urban areas engaged in education and training within the past year, while 25.0% of rural youth are not in education, employment, or training (NEET). iii.Financial inclusion is high, with 94.6% of adults having a bank account. Mobile usage is prevalent, with 95.7% of young people able to use mobile phones, and 82.1% can access the internet. The number of borrowers per 100,000 people was 18,714 in rural areas and 17,442 in urban areas. iv.Digital Skills– Among individuals aged 15-24, 95.7% in rural and 97.0% in urban areas could use a mobile phone. In the same age group, 74.9% in rural and 87.3% in urban areas could send messages with attachments, while only 21.0% in rural and 40.2% in urban areas could perform complex digital tasks like online banking. v.Additionally, 82.1% in rural and 91.8% in urban areas had internet access. Remarkably, 99.5% in rural areas and 99.8% in urban areas were covered by 4G or higher mobile technology. vi.Household Assets and Services– The.