MOAS ASSIGNMENT FD44
Scene 1 (0s)
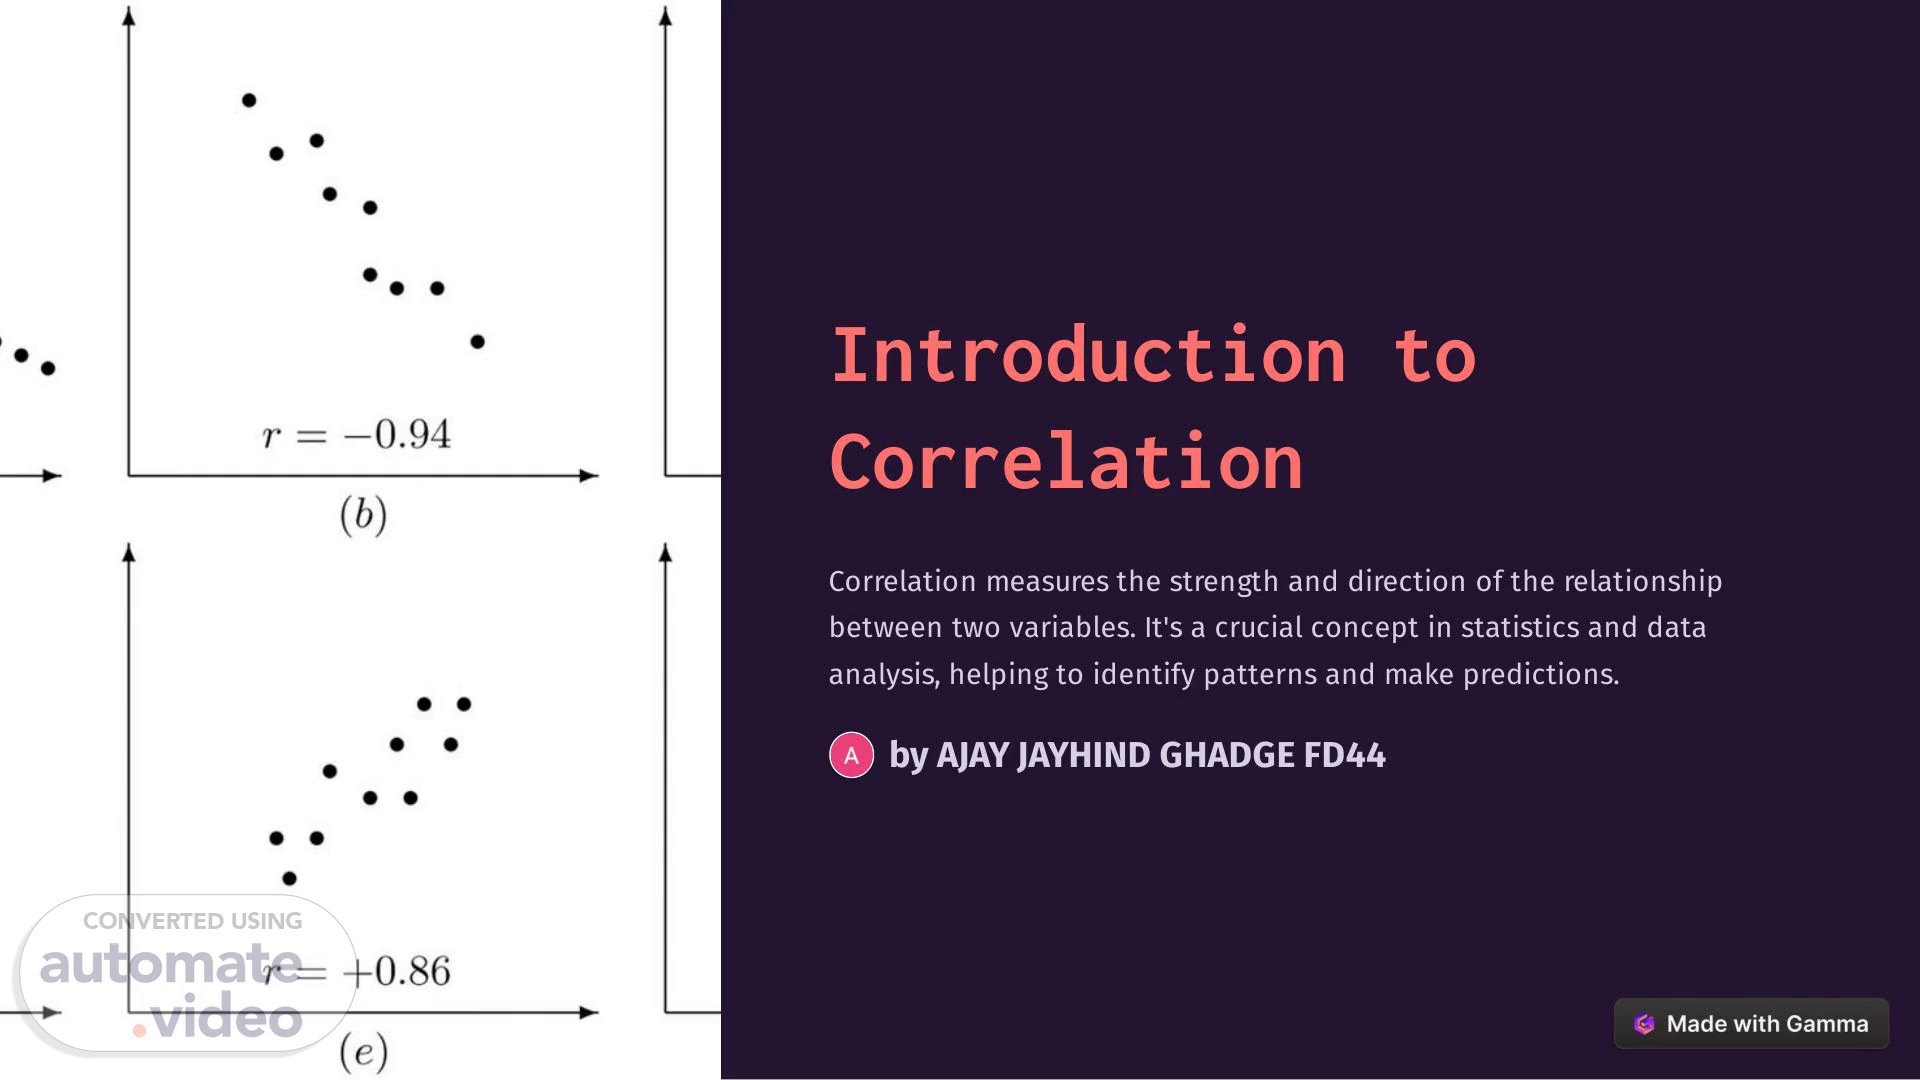
[Audio] Introduction to Correlation Correlation measures the strength and direction of the relationship between two variables. It's a crucial concept in statistics and data analysis, helping to identify patterns and make predictions. by AJAY JAYHIND GHADGE FD44.
Scene 2 (19s)
[Audio] Definition of Bivariate Data Types of Data Bivariate data involves two variables and is used to determine if there is a relationship between them. These variables are often represented as (x, y) pairs. Statistical Analysis It is crucial for comparing and analyzing two sets of data to understand the relationship between them..
Scene 3 (43s)
[Audio] Explanation of Scatter Diagram 1 Visualization Tool A scatter diagram visually represents the relationship between two variables, with one variable on the x-axis and the other on the y-axis. 2 Pattern Recognition It helps in identifying the strength and direction of the relationship between the variables. 3 Use in Data Analysis Provides a clear picture of the correlation between the variables..
Scene 4 (1m 15s)
[Audio] Positive Correlation and Its Representation Definition Positive correlation indicates that as one variable increases, the other variable also tends to increase. Scatter Diagram In the scatter diagram, data points tend to form an upward trend..
Scene 5 (1m 32s)
[Audio] Negative Correlation and Its Representation 1 Definition Negative correlation indicates that as one variable increases, the other variable tends to decrease. 2 Scatter Diagram Data points in the scatter diagram tend to form a downward trend..
Scene 6 (1m 53s)
[Audio] No Correlation and Its Representation 1 Random Distribution No discernible pattern in the scatter diagram, indicating no relationship between the variables. 2 Equal Distribution Data points are scattered randomly across the graph..
Scene 7 (2m 12s)
[Audio] Strength of Correlation and Its Representation Interpretation Strength of correlation helps in determining how closely the data points fit a line or curve. Visual Representation The visual representation in the scatter diagram can indicate strong, moderate, or weak correlation..
Scene 8 (2m 30s)
[Audio] Conclusion and Summary Summary of Types A concise visual summary of positive, negative, and no correlation in scatter diagrams..