How Often Should Microbial Contamination Be Detected in Aircraft Fuel Systems? An Experimental Test of Aluminum Alloy Corrosion Induced by Sulfate-Reducing Bacteria part 2
Scene 1 (0s)
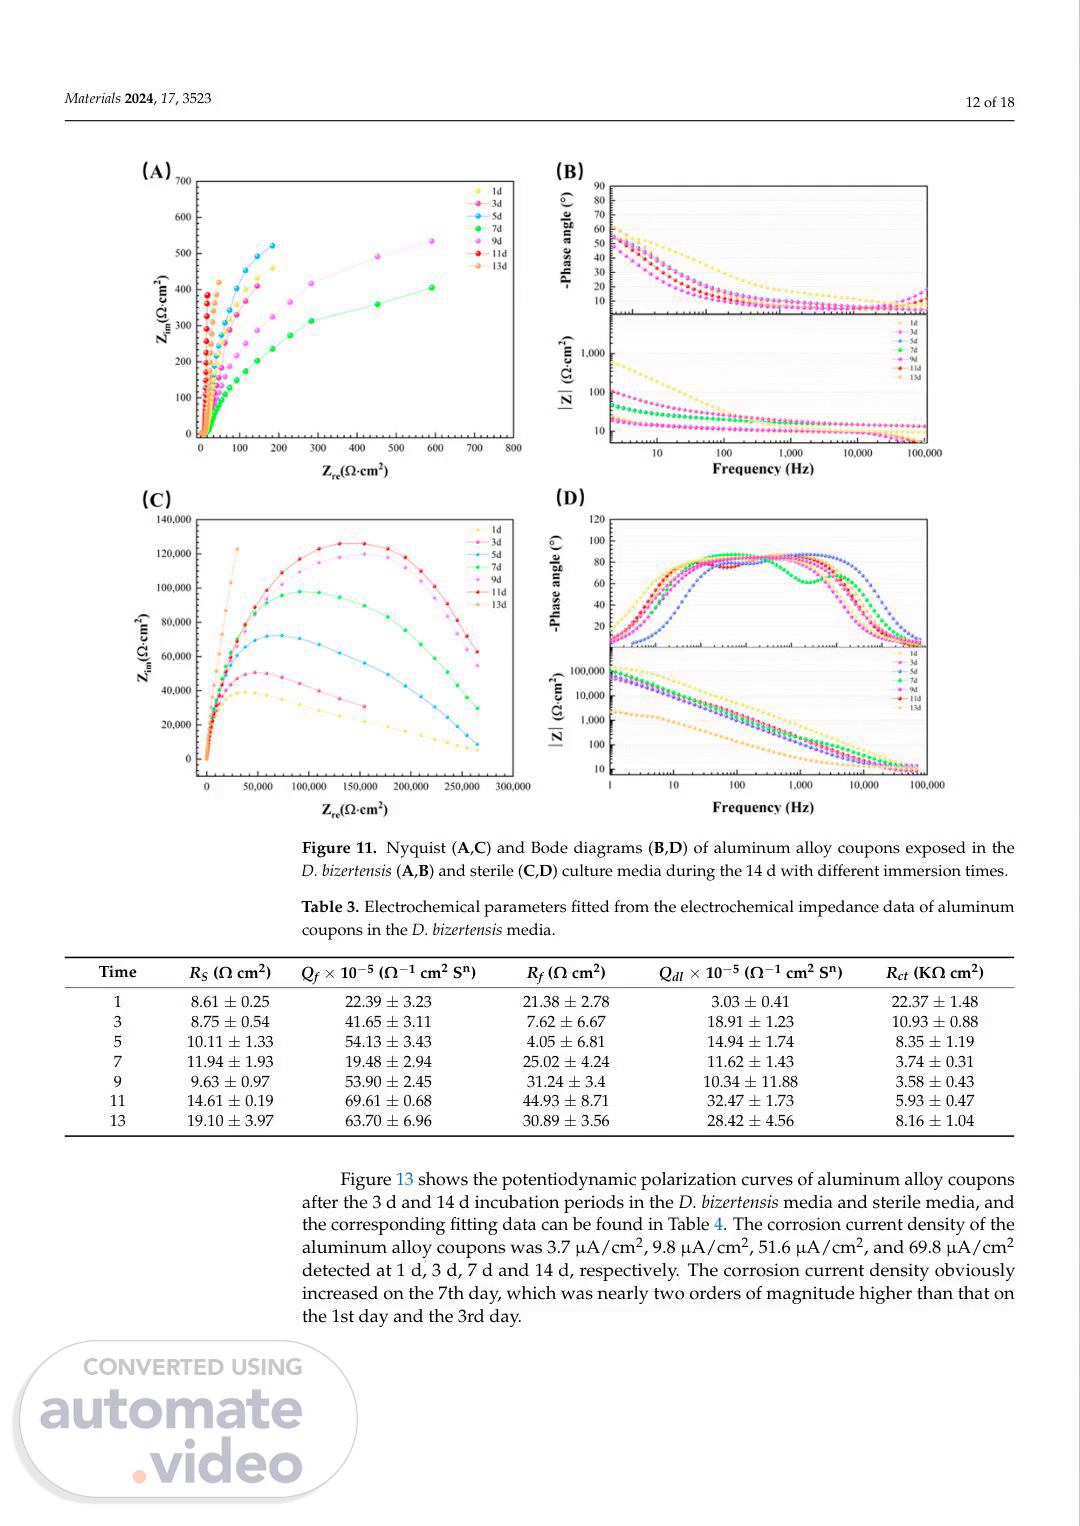
[Audio] Materials 2024, 17, 3523 12 of 18 Figure 10. The O-C-P (A) and pH value (B) of aluminum alloy coupons during the 14 d incubation in the D bizertensis media with different immersion times. Figure 11. Nyquist (A,C) and Bode diagrams (B,D) of aluminum alloy coupons exposed in the D bizertensis (A,B) and sterile (C,D) culture media during the 14 d with different immersion times. Table 3. Electrochemical parameters fitted from the electrochemical impedance data of aluminum coupons in the D bizertensis media. Time RS (Ω cm2) Qf × 10−5 (Ω−1 centimeters2 Sn) Rf (Ω cm2) Qdl × 10−5 (Ω−1 centimeters2 Sn) Rct (KΩ cm2) 1 8.61 ± 0.25 22.39 ± 3.23 21.38 ± 2.78 3.03 ± 0.41 22.37 ± 1.48 3 8.75 ± 0.54 41.65 ± 3.11 7.62 ± 6.67 18.91 ± 1.23 10.93 ± 0.88 5 10.11 ± 1.33 54.13 ± 3.43 4.05 ± 6.81 14.94 ± 1.74 8.35 ± 1.19 7 11.94 ± 1.93 19.48 ± 2.94 25.02 ± 4.24 11.62 ± 1.43 3.74 ± 0.31 9 9.63 ± 0.97 53.90 ± 2.45 31.24 ± 3.4 10.34 ± 11.88 3.58 ± 0.43 11 14.61 ± 0.19 69.61 ± 0.68 44.93 ± 8.71 32.47 ± 1.73 5.93 ± 0.47 13 19.10 ± 3.97 63.70 ± 6.96 30.89 ± 3.56 28.42 ± 4.56 8.16 ± 1.04 Figure 13 shows the potentiodynamic polarization curves of aluminum alloy coupons after the 3 d and 14 d incubation periods in the D bizertensis media and sterile media, and the corresponding fitting data can be found in Table 4. The corrosion current density of the aluminum alloy coupons was 3.7 µA/cm2, 9.8 µA/cm2, 51.6 µA/cm2, and 69.8 µA/cm2 detected at 1 d, 3 d, 7 d and 14 d, respectively. The corrosion current density obviously increased on the 7th day, which was nearly two orders of magnitude higher than that on the 1st day and the 3rd day..
Scene 2 (3m 15s)
[Audio] Materials 2024, 17, x For peer review 14 of 20 Materials 2024, 17, x For peer review 14 of 20 Materials 2024, 17, 3523 13 of 18 Figure 11. Nyquist (A,C) and Bode diagrams (B,D) of aluminum alloy coupons exposed in the D bizertensis (A,B) and sterile (C,D) culture media during the 14 d with different immersion times. Figure 11. Nyquist (A,C) and Bode diagrams (B,D) of aluminum alloy coupons exposed in the D bizertensis (A,B) and sterile (C,D) culture media during the 14 d with different immersion times. Figure 12. Equivalent electrical circuits used for fitting E-I-S spectra for aluminum alloy coupons in the D bizertensis media with different immersion times: (A): R(Q-R---); (B): R(Q(R(Q-R---))). Figure 12. Equivalent electrical circuits used for fitting E-I-S spectra for aluminum alloy coupons in the D bizertensis media with different immersion times: (A): R(Q-R---); (B): R(Q(R(Q-R---))). Figure 12. Equivalent electrical circuits used for fitting E-I-S spectra for aluminum alloy coupons in the D bizertensis media with different immersion times: (A): R(Q-R---); (B): R(Q(R(Q-R---))). Figure 13. Potentiodynamic polarization curves of aluminum alloy coupons after the 3 d (A) and 14 d (B) incubations in the abiotic medium and D bizertensis media. Figure 13. Potentiodynamic polarization curves of aluminum alloy coupons after the 3 d (A) and 14 d (B) incubations in the abiotic medium and D bizertensis media. Table 4. Electrochemical parameters fitted from the potentiodynamic polarization curves of aluminum coupons in the D bizertensis media. Figure 13. Potentiodynamic polarization curves of aluminum alloy coupons after the 3 d (A) and 14 d (B) incubations in the abiotic medium and D bizertensis media. System Time Ecorr/V Icorr × 10−5/A/cm2 Epit/V ∆Ep/V Sterile 3 −0.6671 ± 0.04 1.51 ± 0.43 −0.5572 ± 0.12 0.1099 ± 0.07 14 −0.5922 ± 0.01 4.21 ± 0.96 −0.3981 ± 0.01 0.2150 ± 0.03 S-R-B 3 −0.7658 ± 0.06 0.91 ± 0.19 −0.4332 ± 0.08 0.4673 ± 0.01 14 −0.6254 ± 0.01 6.42 ± 3.08 −0.4724 ± 0.03 0.3485 ± 0.24.
Scene 3 (6m 38s)
[Audio] Materials 2024, 17, 3523 14 of 18 4. Discussion To avoid the detrimental effects caused by the contaminated microbes in aircraft fuel systems, periodic detection and monitoring of the contaminated microbes is an effective way. Based on the recommendations made by the airlines in America, there is a wide range of detection periods for microbial detection, ranging from approximately 1 to 12 months, depending on the number of contaminated microbes in the fuel. An inappropriate testing period leads to increased maintenance costs or heavy security incidents. However, it still lacks a specific standard suitable for microbial corrosion detection in maritime aircraft that face complicated environments. Here, we try to give some suggestions to determine how often the contaminated microbes should be detected. The fundamental logic is like the “wooden barrel effect”—finding the most heavily affected environmental factors as the first step and then performing corrosion tests temporally in the presence of the most corrosive bacterial strains under such harsh conditions. Finally, the time point at which corrosion accelerated significantly was the “key turning point” when microbial detection should be conducted. 4.1. Determine the Environmental Factors That Accelerated M-I-C Most in Aircraft Fuel Systems Based on the results of the orthogonal experiment, water concentration in the fuel systems significantly impacts the M-I-C compared with oxygen and temperature (Figure 3). The water content in the fuel can have a significant impact on the growth and metabolism of microorganisms due to the fact that microorganisms require water for all their physiological activities [35]. Despite this, water has both positive and negative effects on M-I-C in oil–water mixed systems, which depends on the ratio of water and oil. When the water content is below 50%, the activity of microbes is strengthened over the increasing water. However, when the water content is more than 50%, the decreasing fuel concentration also means a reduced nutrient supply [36,37]. Temperature affects the metabolic activity of enzymes in microorganisms, but microorganisms can undergo normal physiological metabolism between 15 C and 35 C Therefore, the temperature in this interval has little effect on M-I-C--. Both increasing oxygen and temperature have a small but negative effect on the M-I-C of aluminum alloy. This may be explained by the fact that it is easier to form the protective passive film for aluminum alloy against M-I-C in environments with higher oxygen and temperature. Unlike the corrosion rate influenced by individual environmental factors, it is more complicated to take all environmental factors into account. According to the analysis of the individual environmental factors, it can be inferred that the most severe M-I-C should happen in an environment with a water content of 50%, oxygen content of 0%, and temperature of 15 C This study clearly shows a different result: M-I-C was the most serious under conditions with a water content of 50%, oxygen content of 0%, and temperature of 35 C, according to an orthogonal experiment (Figure 3A). This implies that orthogonal experiments are a very useful way to assess the influence of various environmental factors on M-I-C in such oil–water systems. 4.2. Determination of the Time Node That SRB-Induced Corrosion Is Accelerated Obviously D bizertensis can degrade fuel oil and obtain nutrient elements such as carbon sources and nitrogen sources to maintain its survival; the acidic metabolites produced by D bizertensis will further lead to the deterioration of fuel oil quality and the corrosion of the aluminum alloy [38–40]. The cell counts reached about 108 cells/mL on the 7th day and remained stable around this value (Figure 4). According to the corrosion weight loss and corrosion rate, the corrosion severity of aluminum alloy samples changed greatly from the 7th.
Scene 4 (10m 57s)
[Audio] Materials 2024, 17, 3523 15 of 18 corrosive environments; hence, it is the “shortest barrel side”. It is recommended to use 7 days as a cycle of fuel detection. 4.3. Corrosion Mechanism Analysis of Aluminum Alloy in Fuel–Water Mixed Systems With the increase in immersion time, both planktonic and sessile D bizertensis cells grew better, as evidenced by the increased planktonic and sessile cell counts (Figure 1) and the denser biofilms in the FM images (Figure 4). The metabolism of D bizertensis converts sulfate to sulfide or H-2-S through a series of reactions. On the one hand, S-R-B can utilize lactic acid as an electron donor (3a) and sulfate as an electron acceptor (3b) to maintain their metabolism. On the other hand, fuel oil can also be used as a carbon source required for the growth of S-R-B--, which can further accelerate the growth of SRB [41,42]. CH3CHOHCOO− plus H2O → CH3COO− plus C-O-2 � g) plus 4H plus plus 4e− (3a) SO2− 4 plus 9H plus plus 8e− → HS− plus 4H2O (3b) In order to prove that the reactions are spontaneous under normal conditions, the equilibrium potential parameters are calculated below [43,44]. 4f Ln Ch3chohcoo− Ee = −0.0163v − 2.303rt F PH − RT � Ch3coo−� · Pco2 (againstSHE) (4a) 8F ln HS− F Ph − Rt Ee = 0.249v − 2.591rt So2− 4 (againstSHE) (4b) ∆G = −nFEcell (5) In Equations (4a,b) and (5), R is the universal constant, T is the absolute temperature, F is the Faraday constant, ρ is the partial pressure, and n means a molar quantity. S-H-E denotes standard hydrogen electrode. At 25 C, 1 M of solute, 1 bar partial pressure for gasses, and pH 7, for Equation (3a), Ee = −430 millivolts (against SHE), and for Equation (3b), Ee = −217 millivolts (against SHE). The cell potential of the redox reaction for Equation (3a,b) is Ecell = plus 213 millivolts. The Gibbs free energy change tends to be negative, as calculated from Equation (4), which means the redox reaction for CH3CHOHCOO−/CH3COO− and SO42−/HS− is thermodynamically favorable. As a metal with high thermodynamic stability, the Al oxidation reaction is shown below. Al − 3e− → Al3 plus (6a) 3F ln[Al3 plus ](againstSHE) (6b) Ee = −1.66 volts plus RT At 25 C, 1 M solution, 1 bar gasses, and pH 7, Ee in Equation (6a) is 737 millivolts for Al/Al3 plus . This means that the Gibbs free energy change tends to be negative. Thus, the Al corrosion caused by S-R-B is thermodynamically favorable. Figure 5 shows that the characteristic peaks of Al2O3 and Al2(O-H---)3 were found, but no trace of Al2S3 was identified because the following reactions may occur. Al3 plus plus HS− plus OH− → Al2S3 plus H2O (7) Al2S3 plus H2O → Al(O-H---)3 plus H2S (8) The relative pitting severity (R-P-S--) can be calculated using the formula shown in Equation (9) RPS = maximum pit growth rate uniform corrosion rate based on specific weight loss (9).
Scene 5 (14m 48s)
[Audio] Materials 2024, 17, 3523 16 of 18 The R-P-S value is 52.1, 18.3, 32.8, and 29.1, corresponding to 1 d, 3 d, 7 d, and 14 d, respectively. They are all much larger than the unity, indicating that pitting corrosion was dominating in this SRB MIC of aluminum alloy. It has been shown that S-R-B accelerates the corrosion damage of aluminum alloy by initiating pitting corrosion [45]. 5. Conclusions Detection and monitoring of microbial contamination in fuel and fuel systems is an effective strategy to prevent M-I-C--. However, the uncertainty about the detection period of microbial contamination in aviation fuel systems under field conditions poses a significant challenge for frontline managers. The ever-changing environments, with varying oxygen levels, humidity, and temperatures from fuel production to transportation and usage, complicate the detection timeframe. In the present study, we provided a novel solution approach to simplify this issue by integrating orthogonal experiments with corrosion tests. The results suggested microbial contamination should be tested at least every 7 days to prevent corrosion damage occurs. This approach carries practical implications for guiding fuel managers or pilots in implementing measures to minimize microbial contamination in the field when encountering uncertain flying environments. Moreover, this study elucidated the influence of environmental factors on microorganisms, highlighting that water content in fuel oil exerts the most significant impact on the M-I-C of aluminum alloy. This underscores the importance of controlling water concentration in fuel as the most effective strategy to manage M-I-C in aircraft fuel systems. In addition, this study also investigated the corrosion behavior of aluminum alloy when immersed in a marine environment containing D bizertensis. The results of the time gradient experiment over a 14-day immersion period revealed varying effects of S-R-B on aluminum alloy corrosion and fuel quality at different growth stages. Notably, during the 7–10-day period when the S-R-B population was most stable, the corrosion rate of the aluminum alloy peaked, accompanied by a significant degradation in fuel quality. Thermodynamic and R-P-S analyses indicated that the M-I-C of the aluminum alloy primarily stemmed from acidic substances produced during S-R-B metabolism under the unique conditions in the present study, which further accelerated corrosion through pitting corrosion amplification. The above results were based on the research on a marine S-R-B--. However, due to the complexity of microorganisms in fuel systems, the synergistic contribution of multiple strains, including bacteria and fungi, to aluminum alloy corrosion in practical working environments still requires in-depth research. Author Contributions: Conceptualization, Y Z and Y L ; methodology, B L , Y Z and D G ; formal analysis, B L ; resources, Y L and D G ; writing—original draft preparation, B L and Y Z ; writing—review and editing, B L , Y Z , Y L , R Z and N C ; visualization, B L ; supervision, Y Z , N C and J D ; project administration, Y Z and J D ; funding acquisition, Y Z All authors have read and agreed to the published version of the manuscript. Funding: This research was supported by the National Natural Science Foundation of China (42206126, 42076044) and the Natural Science Foundation of Shandong Province (No. ZR2021QD099). Data Availability Statement: The original contributions presented in the study are included in the article, further inquiries can be directed to the corresponding authors. Conflicts of Interest: The authors declare no conflict of interest. References 1. Hou, B.; Li, X.; Ma, X.; Du, C.; Zhang, D.; Zheng, M.; Xu, W.; Lu, D.; Ma, F The Cost of Corrosion in China. Npj Mater. Degrad. 2017, 1, 4. [CrossRef] 2. Li, L.; Chakik, M.; Prakash, R A Review of Corrosion in.
Scene 6 (19m 40s)
[Audio] Materials 2024, 17, 3523 17 of 18 4. Forsyth, R A Microbial Induced Corrosion in Ports and Harbors Worldwide. In Proceedings of the Ports 2010, Jacksonville, FL, USA, 22 April 2010; American Society of Civil Engineers: Reston, VA, USA, 2010; pp. 932–939. [CrossRef] 5. Rhee, I Microbiogical Contamination in JP-8 Fuel; S-A-E Technical Paper 2005-01-1802; S-A-E Publications: Warrendale, PA, USA, 2005. [CrossRef] 6. Hill, E C ; Hill, G C Microbial Contamination and Associated Corrosion in Fuels, during Storage, Distribution and Use. Adv. Mater. Res. 2008, 38, 257–268. [CrossRef] 7. Sun, Y Analysis of microbial contamination in aviation fuel. Shandong Chem. Ind. 2015, 9, 121–123. [CrossRef] 8. Wei, X Diagnosis and treatment of typical faults of aircraft wing integral fuel tank. New Technol. New Process 2019, 06, 9–12. [CrossRef] 9. Kong, L Metagenomic Analysis of Petroleum Biodegradation Coupled to Specific N-Cycling Process in Oil-Contaminated Soil. Appl. Soil Ecol. 2024, 193, 105144. [CrossRef] 10. Kang, M.-J. Potential Natural Attenuation of Petroleum Hydrocarbons in Fuel Contaminated Soils: Focusing on Anaerobic Fuel Biodegradation Involving Microbial Fe(I-I-I--) Reduction. Chemosphere 2023, 341, 140134. [CrossRef] 11. Tang, F New Insights of Crude Oil Biodegradation Construction by Microbial Consortium B-1-0--: Responded Substrates, Genomics, Biodegradation Mechanism and Pathways. Chem. Eng. J 2023, 478, 147143. [CrossRef] 12. Raikos, V.; Vamvakas, S S ; Sevastos, D.; Kapolos, J.; Karaiskakis, G.; Koliadima, A Water Content, Temperature and Biocide Effects on the Growth Kinetics of Bacteria Isolated from JP-8 Aviation Fuel Storage Tanks. Fuel 2012, 93, 559–566. [CrossRef] 13. Gaylarde, C C Microbial contamination of stored hydrocarbon fuels and its control. Rev. Microbiol. 1999, 30, 01–10. [CrossRef] 14. Li, J.; Li, J.; Yuan, W.; Du, Y Biocorrosion Characteristics of the Copper Alloys BFe30-1-1 and HSn70-1AB by S-R-B Using Atomic Force Microscopy and Scanning Electron Microscopy. Int. Biodeterior. Biodegrad. 2010, 64, 363–370. [CrossRef] 15. Jia, R.; Unsal, T.; Xu, D.; Lekbach, Y.; Gu, T Microbiologically Influenced Corrosion and Current Mitigation Strategies: A State of the Art Review. Int. Biodeterior. Biodegrad. 2019, 137, 42–58. [CrossRef] 16. Yin, X Research status of microbial corrosion in fuel tank of civil aviation aircraft. Corros. Prot. 2019, 40, 366–369. [CrossRef] 17. Xu, D Stainless steel corrosion via direct iron-to-microbe electron transfer by Geobacter species. In Proceedings of the 1st Corrosion and Materials Degradation Web Conference, Virtual, 17–19 May 2021; M-D-P-I-: Basel, Switzerland, 2021. [CrossRef] 18. Tang, H.-Y.; Holmes, D E ; Ueki, T.; Palacios, P A ; Lovley, D R Iron Corrosion via Direct Metal-Microbe Electron Transfer. ASM J 2019, 10. [CrossRef] [PubMed] 19. Cui, Y Microbial Corrosion Law of 7075 Aluminum Alloy Used for Engine and Oil Tank in Accumulated Water Environment. Mater. Prot. 2014, 47, 29–32. [CrossRef] 20. Jia, L Microbial Corrosion Behavior of 7075-T6 Magnesium-Aluminum Alloy. Total Corros. Control 2013, 27, 56–60. 21. Passman, F J Microbial contamination and its control in fuels and fuel systems since 1980 a review. Int. Biodeterior. Biodegrad. 2013, 81, 88–104. [CrossRef] 22. Chung, Y Temperature and water effects on the biodeterioration for marine fuel oil. Fuel 2000, 79, 1525–1532. [CrossRef] 23. Abd El Rehim, S S ; Hassan, H H ; Amin, M A Corrosion Inhibition Study of Pure Al and Some of Its Alloys in 1.0 M HCl Solution by Impedance Technique. Corros. Sci. 2004, 46, 5–25. [CrossRef] 24. Liu, B Research status and prospect of aluminum alloys for large aircraft. Chin. J Nonferrous Met. 2010, 20, 1705–1715. [CrossRef] 25. Zhou, Z.; Ge, X.; Fan, W.; Shan, B.; Yang, J Research on accelerating the corrosion of 7B04 aluminum alloy in the Lacticaseibacillus paracasei environment. J Appl. Electrochem. 2024, 54, 381–392. [CrossRef] 26. Cordas, C M ; Guerra, L T ; Xavier, C.; Moura, J J G Electroactive Biofilms of Sulphate Reducing Bacteria. Electrochim. Acta 2008, 54, 29–34. [CrossRef] 27. Tuck, B.; Watkin, E.; Somers, A.; Machuca, L L A Critical Review of Marine Biofilms on Metallic Materials. Npj Mater. Degrad. 2022, 6, 25. [CrossRef] 28. Marks, C R ; Duncan, K.
Scene 7 (24m 40s)
[Audio] Materials 2024, 17, 3523 18 of 18 36. Igo, M J Quantifying the Influence of Relative Humidity, Temperature, and Diluent on the Survival and Growth of Enterobacter Aerogenes. J Food Prot. 2019, 82, 2135–2147. [CrossRef] [PubMed] 37. Abubakar, A Crude Oil Biodegradation Potential of Lipase Produced by Bacillus subtilis and Pseudomonas aeruginosa Isolated from Hydrocarbon Contaminated Soil. Environ. Chem. Ecotoxicol. 2024, 6, 26–32. [CrossRef] 38. Puntus, I F Contribution of Soil Bacteria Isolated from Different Regions into Crude Oil and Oil Product Degradation. J Soils Sediments 2019, 19, 3166–3177. [CrossRef] 39. Liu, Y.; Wan, Y Y ; Zhu, Y.; Fei, C.; Shen, Z.; Ying, Y Impact of Biodegradation on Polar Compounds in Crude Oil: Comparative Simulation of Biodegradation from Two Aerobic Bacteria Using Ultrahigh-Resolution Mass Spectrometry. Energy Fuels 2020, 34, 5553–5565. [CrossRef] 40. Guan, F Interaction between Sulfate-Reducing Bacteria and Aluminum Alloys Corrosion Mechanisms of 5052 and Al-Zn-In-Cd Aluminum Alloys. J Mater. Sci. 2020, 36, 55–64. [CrossRef] 41. Chen, Z Influence of Nutrition on Cu Corrosion by Desulfovibrio vulgaris in Anaerobic Environment. Bioelectrochemistry 2022, 144, 108040. [CrossRef] 42. Dou, W Corrosion of Cu by a Sulfate Reducing Bacterium in Anaerobic Vials with Different Headspace Volumes. Bioelectrochemistry 2020, 133, 107478. [CrossRef] 43. Pu, Y Enhancement of Exogenous Riboflavin on Microbiologically Influenced Corrosion of Nickel by Electroactive Desulfovibrio vulgaris Biofilm. Npj Mater. Degrad. 2023, 7, 7. [CrossRef] 44. Xu, D Laboratory Investigation of Microbiologically Influenced Corrosion of C-1-0-1-8 Carbon Steel by Nitrate Reducing Bacterium Bacillus licheniformis. Corros. Sci. 2013, 77, 385–390. [CrossRef] 45. Örnek, D Pitting corrosion control using regenerative biofilms on aluminum 2024 in artificial seawater. Corros. Sci. 2001, 43, 2121–2133. [CrossRef] Disclaimer/Publisher’s Note: The statements, opinions and data contained in all publications are solely those of the individual author(s) and contributor(s) and not of M-D-P-I and/or the editor(s). M-D-P-I and/or the editor(s) disclaim responsibility for any injury to people or property resulting from any ideas, methods, instructions or products referred to in the content..