Page 1 (0s)
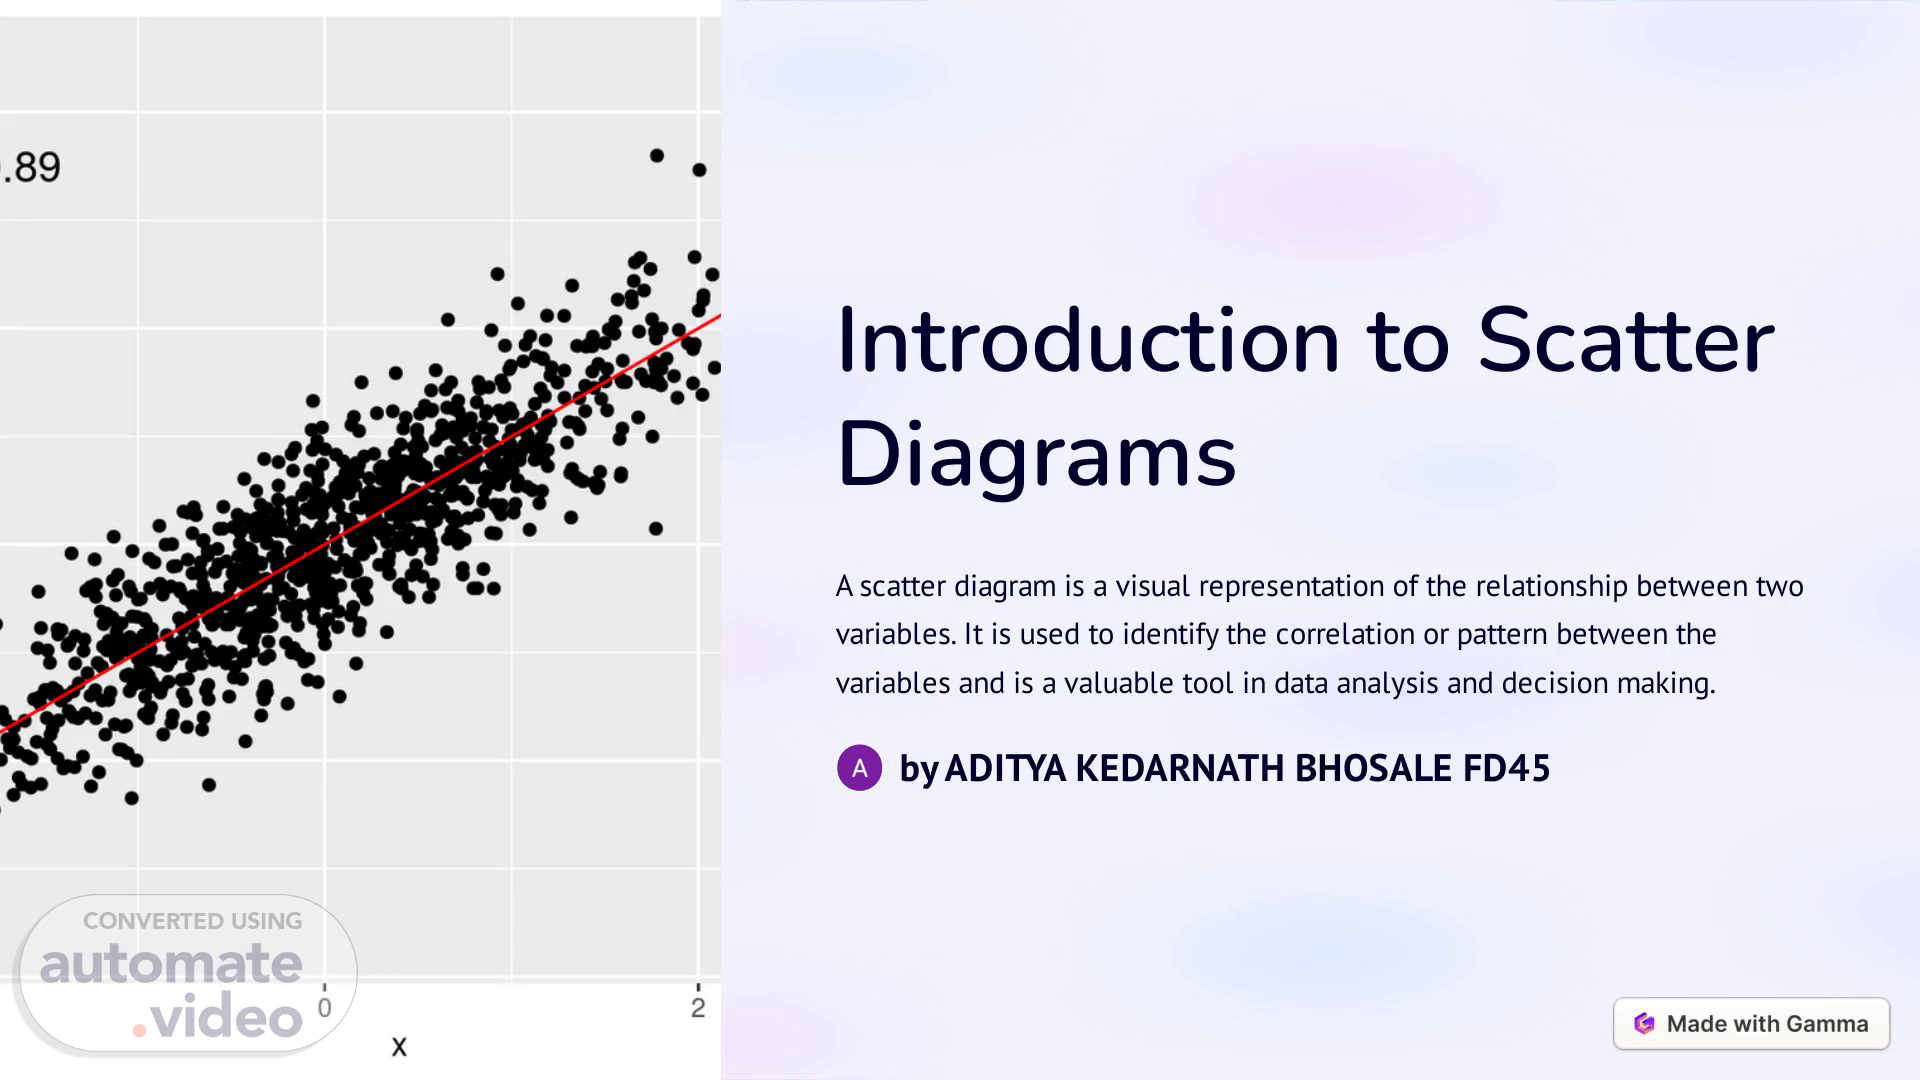
[Audio] Introduction to Scatter Diagrams A scatter diagram is a visual representation of the relationship between two variables. It is used to identify the correlation or pattern between the variables and is a valuable tool in data analysis and decision making. by ADITYA KEDARNATH BHOSALE FD45.
Page 2 (21s)
[Audio] Purpose and Benefits of Using Scatter Diagrams Data Visualization Scatter diagrams provide a clear and concise visualization of the relationship between variables, making it easier to identify patterns and trends. Correlation Analysis They help in understanding the strength and direction of the relationship between variables, enabling better decision-making based on the data. Pattern Identification Scatter diagrams help in identifying any patterns, clusters, or outliers within the data, which can be crucial for root cause analysis..
Page 3 (55s)
[Audio] Simple Scatter Diagram Definition A simple scatter diagram shows individual data points with no clear pattern or trend, indicating a weak or no correlation between the variables. Characteristics It consists of data points scattered randomly with no apparent relationship, making it easier to identify the lack of correlation..
Page 4 (1m 17s)
[Audio] Cluster Scatter Diagram 1 Definition A cluster scatter diagram shows data points grouped into clusters, indicating a potential correlation within each cluster. 2 Usage It is used to identify multiple subgroups within the data set and can provide insights into complex relationships between variables. 3 Interpretation Analyzing cluster scatter diagrams helps in understanding the behavior and characteristics of each cluster within the dataset..
Page 5 (1m 51s)
[Audio] Linear Scatter Diagram 1 Characteristics It shows a clear, straightline relationship between the variables, indicating a strong positive or negative correlation. 2 Usage Commonly used to depict cause-and-effect relationships, making it valuable in predictive analytics and forecasting models. 3 Interpretation It helps in understanding the degree and direction of the relationship between variables, facilitating better decision-making..
Page 6 (2m 25s)
[Audio] Non-linear Scatter Diagram Definition It depicts a curved or nonlinear relationship between the variables, indicating a complex correlation pattern. Usage Commonly utilized in scientific research and modeling to represent non-linear phenomena and complex interactions. Interpretation Understanding non-linear scatter diagrams is crucial for identifying unexpected patterns and relationships within the data..
Page 7 (2m 52s)
[Audio] Outlier Scatter Diagram 1 Identification Outlier scatter diagrams help in identifying data points that significantly deviate from the overall pattern, indicating anomalies. 2 Impact Understanding outliers is essential in statistical analysis as they can heavily influence the results and conclusions drawn from the data. 3 Solutions Analyzing and addressing outliers is crucial for ensuring accurate and reliable data-driven insights and decision-making..
Page 8 (3m 27s)
[Audio] Conclusion and Key Takeaways Decision Support Scatter diagrams are valuable tools in decision-making, providing visual insights into the relationships between variables. Data Analysis They aid in data analysis by identifying patterns, correlations, and anomalies, leading to informed and effective decisions. Future Applications Understanding the types of scatter diagrams is crucial for their future applications in research, business, and scientific endeavors..