PowerPoint Presentation
Scene 1 (0s)
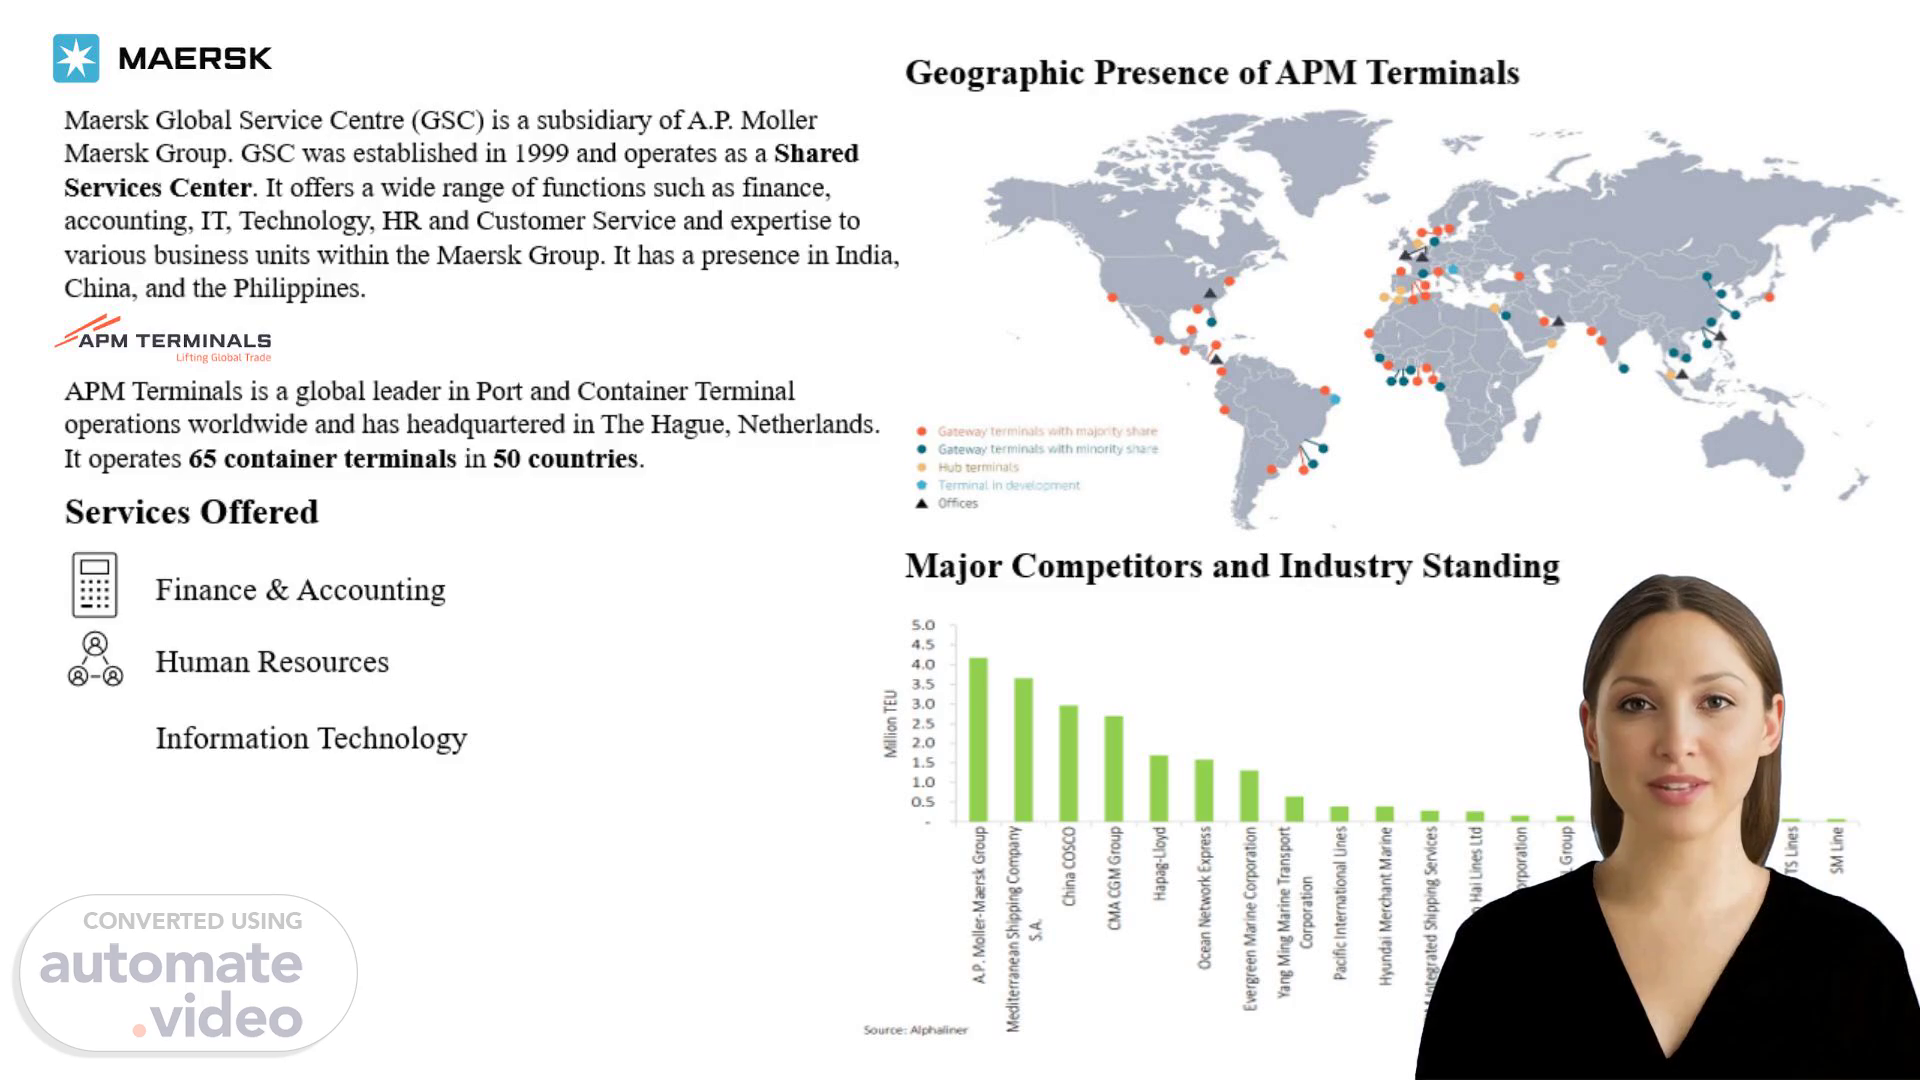
[Virtual Presenter] We are a global leader in port and container terminal operations with a presence in 50 countries. We operate 65 container terminals worldwide. Our focus is on finance & accounting human resources information technology services and expertise. We deliver exceptional results for our clients with an annual turnover of U-S-D 3.8 billion. We have a Maersk Global Service Centre (G-S-C--) that offers a wide range of services. We are confident in our ability to grow the ports and terminal operations market with an estimated C-A-G-R of 10.46% between 2023 and 2028. Join us as we lead the way in port and terminal operations worldwide..
Scene 2 (47s)
[Audio] A-P-M Terminals is a global leader in port and container terminal operations with a presence in 50 countries and headquartered in The Hague Netherlands. Our total number of container terminals is 65 worldwide. Our financial and operational strategy is centered around precise and detailed costing. One way to analyze cost in A-P-M Terminals is the Unit Costing Analysis on a per-month basis where costs are analyzed on a per-move basis calculated by dividing the total cost incurred to load/offload store and other activities related to that Vessel that take place on the port with the number of moves involved in carrying out those activities at the port. Unit costing is structured into several distinct categories to comprehensively analyze the costs associated with terminal operations. The objective of this report is to provide management with a clear understanding of the primary cost drivers within each category and identify terminals across regions that contribute significantly to each category and overall costs. We analyzed costs in the following categories: Selling General and Administrative Costs Energy Cost Frontline Labour Cost Maintenance and Repair Cost Concession Cost Depreciation Cost and Other Cost. Additionally we prepared a Weekly Volume & Productivity Report for the Africa and Europe Region which involved collecting and analyzing weekly volume data from all the terminals within the Africa and Europe regions and included metrics on crane hours per move and man hours per move highlighting efficiency and productivity levels..
Scene 3 (2m 33s)
[Audio] Our data analysis process involves several key steps we utilize to extract and analyze data within our organization. We begin with data retrieval from our OneStream platform which serves as a comprehensive reporting platform encompassing financial and operational key performance indicators (KPIs) for all subsidiaries of AP Moller Maersk. We use a dedicated Excel add-in provided by Maersk G-S-C to facilitate this process. To extract the data we follow a specific and defined process which involves the initial establishment of specific points of view (POVs) which then facilitates the retrieval of the required data. This process ensures that we are able to extract the data that is relevant to our specific needs and goals. Once the data has been retrieved we move on to data processing which involves calculating deviations on Excel and interpreting the analyzed data. This step allows us to identify areas where we can improve our operations and make data-driven decisions. We have also developed a data collection approach for major projects and minor projects. This approach ensures that we are able to gather the data that is necessary to make informed decisions and make improvements to our operations. Overall our process is designed to be efficient and effective allowing us to make data-driven decisions that drive our success..
Scene 4 (3m 59s)
[Audio] We analyzed the cost of our port and container terminal operations in detail examining the costs of frontline labour concession energy maintenance & repair and energy costs. Our findings reveal that frontline labour costs exceeded budgeted expectations in April and May due to lower C-H-P-M and higher M-H-P-M-. However we saw a consistent decrease in concession costs in both months mainly due to operational adjustments and marginal reductions in concession expenses. We found that energy costs reduced in both months driven by lower energy consumption and the implementation of energy-efficient practices and technologies. In terms of maintenance & repair costs we found an increase in April due to higher facility crane maintenance expenses and increased consumption of S-T-S crane parts and higher mechanical costs in crane and power shop. However in May we saw a decrease in these costs due to better cost management and reclassification of expenses..
Scene 5 (5m 4s)
[Audio] Our analysis has revealed that actual costs exceeded budgeted expectations in April and May mainly due to a decrease in C-H-P-M and an increase in M-H-P-M-. This led to higher labour costs. In contrast concession costs were consistently lower-than-budgeted in both months mainly due to operational adjustments and marginal reductions in concession expenses. Energy costs were consistently lower-than-budgeted in both months driven by lower energy consumption and the implementation of energy-efficient practices and technologies. Maintenance & repair costs were more than budgeted in April and decreased in May mainly due to higher facility and crane maintenance expenses and increased consumption of S-T-S crane parts. Better cost management and reclassification of expenses led to a decrease in costs in May. Overall our company is committed to ensuring the long-term success of our business..
Scene 6 (6m 7s)
[Audio] We are a global leader in the port and container terminal operations industry. Our analysis shows that we consistently have lower-than-budgeted Selling General & Administration (SG&A) costs in both months. This is due to significant reductions in staff (I-T ) administration and integration costs leading to a lower overall SG&A cost. Additionally we note that depreciation costs were persistently lower than budgeted across both months. This was due to efficient asset management and utilization delays in capital expenditure and asset capitalization and adjustments in depreciation schedules. In terms of cost efficiency we recommend optimizing SG&A expenses enhancing energy efficiency initiatives and strengthening asset management. We also suggest monitoring and controlling frontline labor costs to ensure cost efficiency. We are confident that these recommendations will help us improve our bottom line and drive growth in the port and container terminal operations market..
Scene 7 (7m 13s)
[Audio] We want to share our experience with Left Brain and Building Outline. These two tools have helped us structure tasks more effectively enabling us to complete them well before the given deadlines. With Left Brain we improved our productivity and learned to manage multiple tasks simultaneously. We became more adept at working efficiently with team members towards common goals. With Building Outline we developed our understanding of effective communication strategies and learned to adapt our communication style to suit different stakeholders' needs. We gained a better understanding of A-P-M Terminal and Maersk G-S-C business and its functioning and coordination with subsidiaries. We hope that you find these tools useful as well..