Scene 1 (0s)
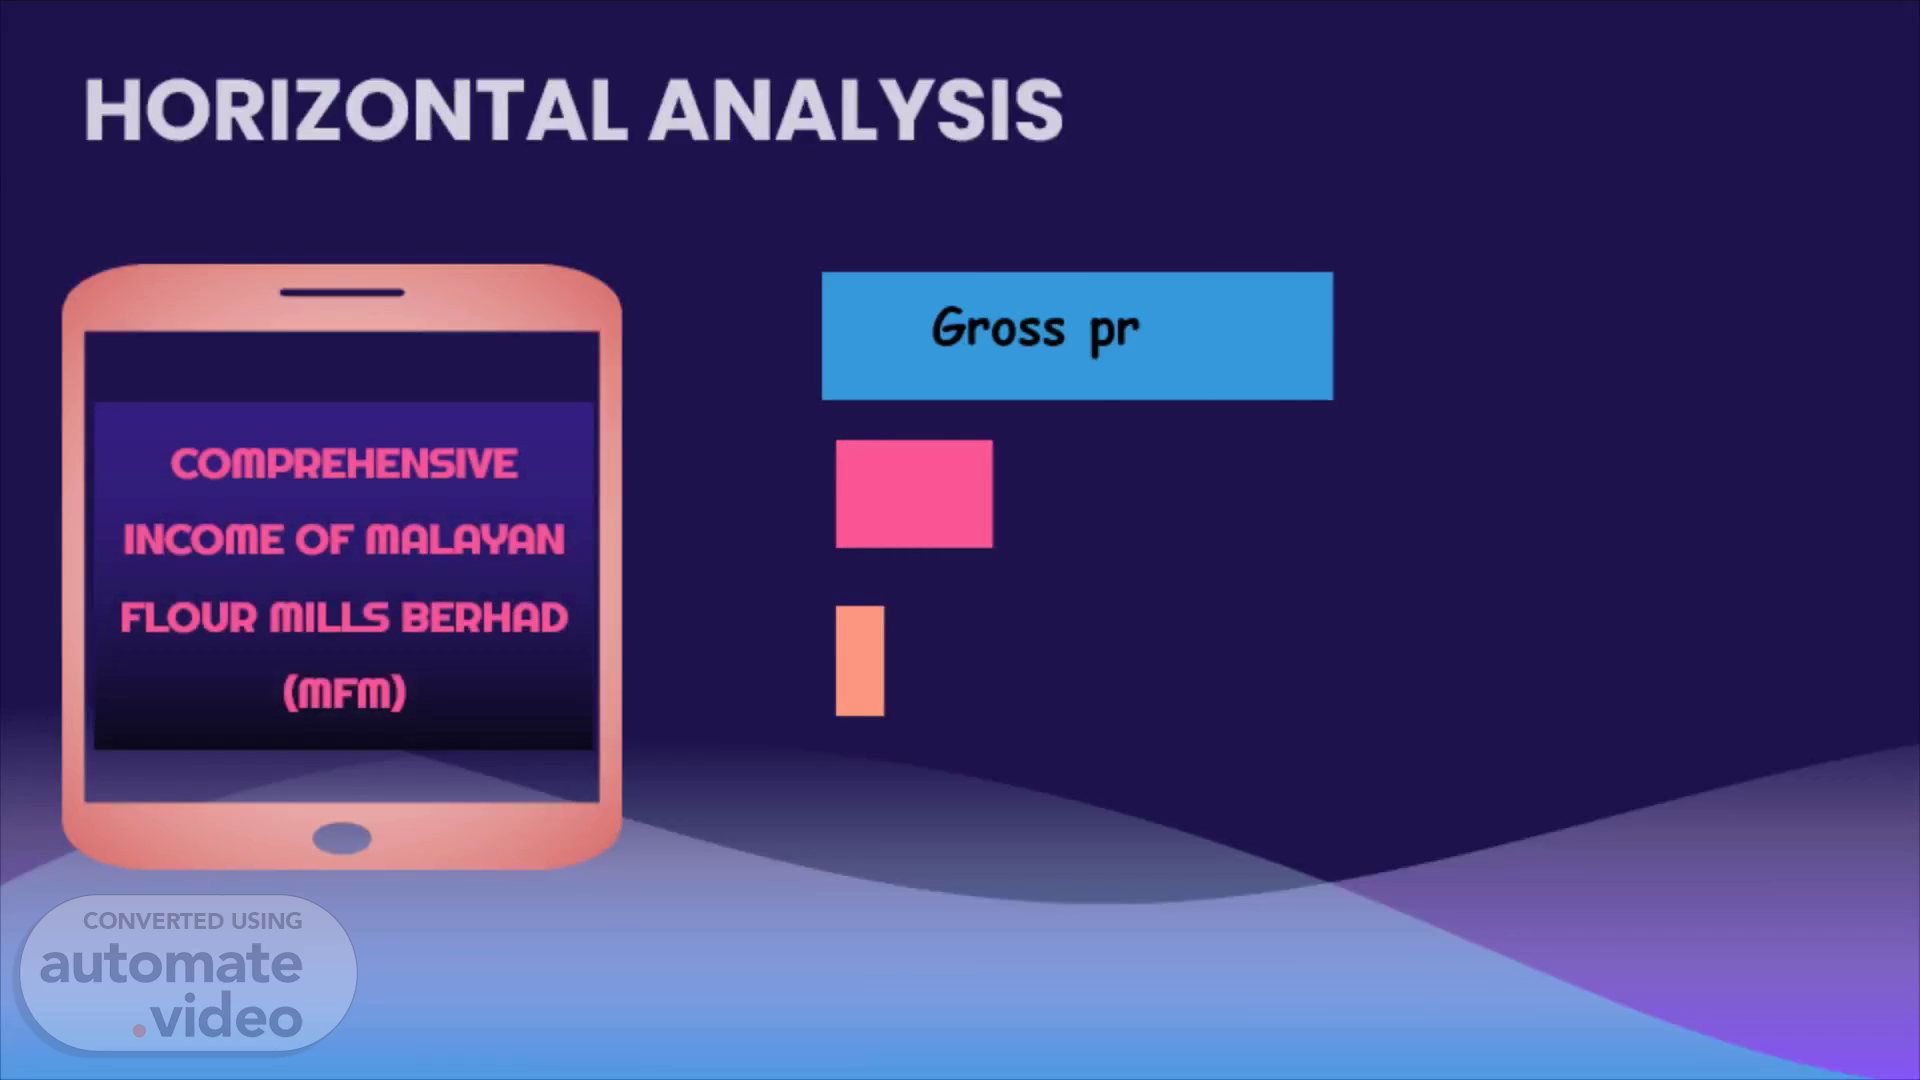
HORIZONTAL ANALYSIS. COMPREHENSIVE INCOME OF MALAYAN FLOUR MILLS BERHAD (MFM).
Scene 2 (10s)
150 50 o -100 2018 2019 2020 COMPREHENSIVE Other Income Gross Profit -8.32 4.4 -14.07 -30.76 12 73.41 2018 INCOME Profit Before Tax -58.61 -53-98 Net Profit of The Year -27.45 130.37 -58.59 2019 2020.
Scene 3 (30s)
GROSS PROFIT. -8.32. 4.4. -14.07. %. 2018. 2019. 2020.
Scene 4 (1m 1s)
OTHER INCOME. -30.76. 12. 73.41. 2018. 2019. 2020.
Scene 5 (1m 35s)
PROFIT BEFORE TAX. -58.61. 96.06. -53.98. %. 2018.
Scene 6 (2m 9s)
NET PROFIT OF THE YEAR. -27.45. 130.37. -58.59. %.
Scene 7 (2m 28s)
HORIZONTAL ANALYSIS. FINANCIAL STATEMENT OF MALAYAN FLOUR MILLS BERHAD (MFM).
Scene 8 (2m 44s)
BALANCE SHEET 90 80 70 60 50 40 27 30 19.66 20 10 -10 -20 2017-2018 2018-2019 . 2019-2020 17.65 3.44 81.84 53.92 0.38 Non-current li abilities 81.84 53.92 0.38 .2019-2020 4.5 2.85 1.3 -3.33 -6.45 Current assets Non-curre nt assets 27 19.66 3.44 2017-2018 -6.45 17.65 -3.33 2018-2019 Current liabilities 4.5 2.85 1.3.
Scene 9 (2m 53s)
NON-CURRENT ASSETS. 27. 19.66. 3.44. %. 2017-2018.
Scene 10 (3m 11s)
CURRENT ASSETS. -6.45. 17.65. -3.33. %. 2017-2018.
Scene 11 (3m 53s)
NON-CURRENT LIABILITIES. 81.84. 53.92. 0.38. %. 2017-2018.
Scene 12 (4m 39s)
TREND ANALYSIS. Year 2020 [RM’000] 2019 [RM’000] 2018 [RM’000] 2017 [RM’000] 2016 [RM’000] Revenue [RM’000] RM 2,680,670 RM 2,538,686 RM 2,681,563 RM 2,538,686 RM 2,423,744 RM 2,538,686 RM 2,402,283 RM 2,538,686 RM 2,538,686 RM 2,538,686 Trend Percentages [%] 105.59% 105.62% 95.47% 94.62% 100%.
Scene 13 (5m 0s)
VERTICAL ANALYSIS. • Comprehensive income • Balance sheet • Common-Size Income Statement – Malayan Flour Mills Berhad Versus PPB Group Berhad.
Scene 14 (5m 32s)
Big numbers catch your audience’s attention. Comprehensive Income 12 10 8 6 4 2 10.28 9.71 8.34 Gross profit 3.08 2.69 1.95 Operating (loss)/ profit "2018 '2019 .2020 2.26 1.13 Profit before taxation 0.77 2.22 1.05 0.32 Total comprehensive income.
Scene 15 (5m 43s)
GROSS PROFIT %. 2018 - 10.38% 2019 - 9.71% 2020 - 8.34%.
Scene 16 (6m 43s)
PROFIT BEFORE TAXATION %. 2018 - 1.05% 2019 - 2.23% 2020 - 0.32%.
Scene 17 (8m 14s)
It’s the hottest. Venus. It has several rings. Saturn.
Scene 18 (8m 25s)
NON-CURRENTS ASSETS %. CURRENT ASSETS %. 2018 - 48.76% 2019 - 49.18% 2020 -50.88%.
Scene 19 (10m 9s)
TOTAL LIABI LITIES %. • The percentage of total equity increases from 2018 to 2019. This is because the amount of total equity in 2018 and 2019 are increases. • The percentage of total equity in 2020 is decrease from 2019 because the total amount of equity in 2020 is decrease..
Scene 20 (11m 28s)
Common-Size Income Statement – Malayan Flour Mills Berhad Versus PPB Group Berhad.
Scene 21 (11m 41s)
GROSS PROFIT %. Malayan Flour Mills Berhad: 8.34% PPB Group Berhad: 10.26%.
Scene 22 (12m 52s)
INCOME TAX EXPENSE %. Malayan Flour Mills Berhad: 0.58% PPB Group Berhad: 1.37%.