Scene 1 (0s)
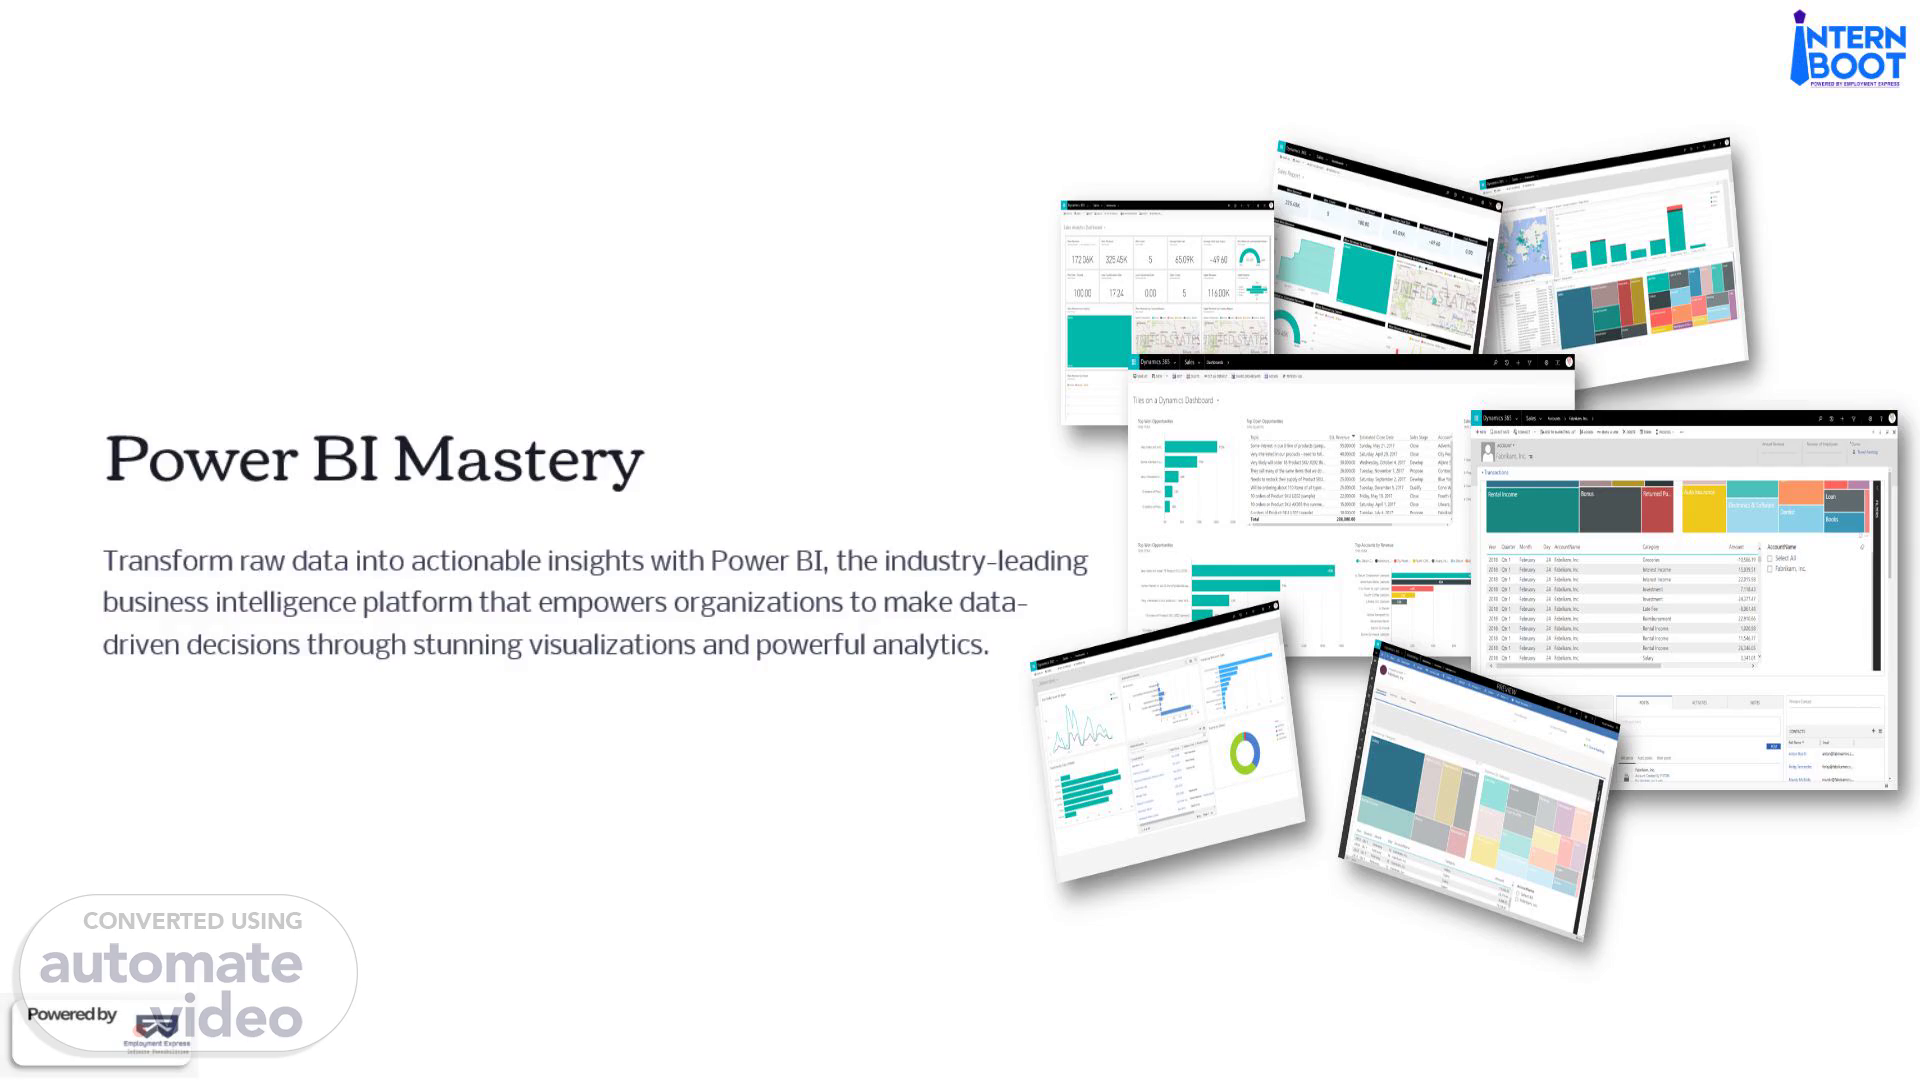
[Audio] Power (B-I ) Mastery Transform raw data into actionable insights with Power (B-I ), the industry leading business intelligence platform that empowers organizations to make data driven decisions through stunning visualizations and powerful analytics..
Scene 2 (21s)
[Audio] What We'll Cover Today Power (B-I ) Visuals Key Advantages Explore the comprehensive chart library and visualization options Understand why Power (B-I ) outperforms traditional tools Data Connectivity Power Query Connect to 70 plus data sources seamlessly Master data cleaning and transformation Data Modeling DAX Formulas Build relationships between tables Perform advanced calculations Interactive Features Cloud Sharing Create dynamic, explorable dashboards Publish and collaborate organization wide.
Scene 3 (1m 0s)
[Audio] Power (B-I ) Visuals: Your Chart Arsenal Power (B-I ) offers a rich library of visualization options to bring your data to life. Each chart type serves a specific purpose in telling your data story effectively. Bar Chart Line Chart Pie & Donut Charts Compare values across categories with horizontal or vertical bars Track trends and changes over time periods Show proportions and percentages of a whole Cards (KPIs) Table & Matrix Slicers Display single important metrics prominently Present detailed data in organized rows and columns Enable interactive filtering across your dashboard Maps Tree Map Scatter Chart Visualize geographic data and regional patterns Display hierarchical data with nested rectangles Reveal relationships between two variables.
Scene 4 (1m 58s)
[Audio] Why Power (B-I ) Wins Easy to Use Intuitive drag and drop interface requires no coding skills Professional Dashboards Create stunning, executive ready visualizations in minutes Faster Than Excel Process and analyze data at speeds Excel simply can't match Big Data Ready Handle millions of rows without performance degradation Time Saver Automated refresh eliminates manual data updates Business Intelligence Perfect for corporate reporting and strategic decision making.
Scene 5 (2m 32s)
[Audio] Connect to Any Data Source Power (B-I )'s universal connectivity is one of its greatest strengths. With support for 70 plus data sources, you can import data from virtually anywhere in just a few clicks, eliminating data silos and creating a unified view of your business. Files Excel spreadsheets CSV files Text files Databases SQL Server Mysql Oracle PostgreSQL Cloud Services Azure A-W-S Google Analytics Salesforce Web & apis Rest Apis SharePoint Web pages OData feeds Use Case: Import data from anywhere in a few clicks, creating a single source of truth for your organization..
Scene 6 (3m 22s)
[Audio] Power Query: Clean Data Without Coding Transform Your Data Remove Duplicates Power Query is your data preparation powerhouse, enabling you to clean, transform, and shape data without writing a single line of code. This visual interface makes data preparation accessible to everyone. Eliminate redundant records instantly Clean Missing Values Handle nulls and blanks intelligently Use Case: Clean and prepare messy data sources automatically, saving hours of manual work. Split/Merge Columns Restructure data to fit your needs Filter Rows Keep only the data you need Change Data Types Ensure proper formatting for analysis Combine Tables Join multiple data sources seamlessly.
Scene 7 (4m 14s)
[Audio] Data Modeling: Building Relationships Just like S-Q-L--, Power (B-I ) allows you to create sophisticated relationships between multiple tables, building a unified data model that ensures accuracy and consistency across all your reports. This relational approach is fundamental to creating powerful, scalable analytics solutions. Sales Table Customer Table Transaction records with dates, amounts, and product IDs Customer demographics, contact info, and segments Product Table Product details, categories, and pricing information Power (B-I ) automatically links these tables through primary and foreign keys, creating a star schema or snowflake schema that optimizes query performance and maintains data integrity. Use Case: Build a single, comprehensive data model that powers accurate reports across your entire organization..
Scene 8 (5m 18s)
[Audio] D-A-X-: Advanced Calculations Made Simple DAX (Data Analysis Expressions) is Power (B-I )'s powerful formula language that enables sophisticated calculations and business logic. While it may seem complex at first, D-A-X unlocks the true analytical potential of your data. Total Sales Profit Margins Year to Date Sales Calculate aggregate revenue across all transactions Compute profitability metrics and percentages Track cumulative performance over time periods Total Sales = SUM(Sales[Amount]) Profit = [Total Sales] [Total Cost] YTD Sales = totalytd([Total Sales], Dates[Date]) Category Performance Year over Year Comparison Analyze metrics by product categories or segments Compare current performance to previous periods Category Sales = CALCULATE([Total Sales], Products[Category]) Sales LY = CALCULATE([Total Sales], sameperiodlastyear(Dates[Date])) Use Case: Perform advanced calculations and create custom business metrics without complex programming..
Scene 9 (6m 31s)
[Audio] Interactive Dashboards That Users Love Beautiful & Explorable Power (B-I ) transforms static reports into dynamic, interactive experiences. Users can click, filter, and explore data on their own, discovering insights without needing to contact the analytics team. Filters & Slicers Slicers provide intuitive filtering capabilities that make dashboards truly interactive and user friendly: By Date: Filter to specific time periods or date ranges By Region: Focus on geographic areas of interest By Product: Drill down into specific product lines By Category: Segment data by business categories Use Case: Enable easy filtering without editing the report, empowering users to find their own answers. Cross Filtering Click one chart to filter all others automatically Drill Down Navigate from summary to detailed views seamlessly Tooltips Hover for additional context and information Bookmarks Save and share specific views of your data.
Scene 10 (7m 40s)
[Audio] Power (B-I ) Service: Share & Collaborate After creating your dashboard, Power (B-I ) Service enables seamless cloud based sharing and collaboration. Publish your work online and make it accessible across your entire organization with enterprise grade security and governance. Publish Online Upload dashboards to the cloud with one click Share with Teams Distribute reports to management and stakeholders Set Permissions Control access with granular security settings Auto Refresh Schedule automatic data updates daily or hourly Embed Anywhere Integrate dashboards into websites or applications Enterprise Ready Use Case: Share dashboards across the organization, ensuring everyone has access to the insights they need, when they need them. Power (B-I ) Service provides the infrastructure needed for organization wide analytics deployment, with features like row level security, audit logs, and compliance certifications..