PptxGenJS Presentation
Scene 1 (0s)
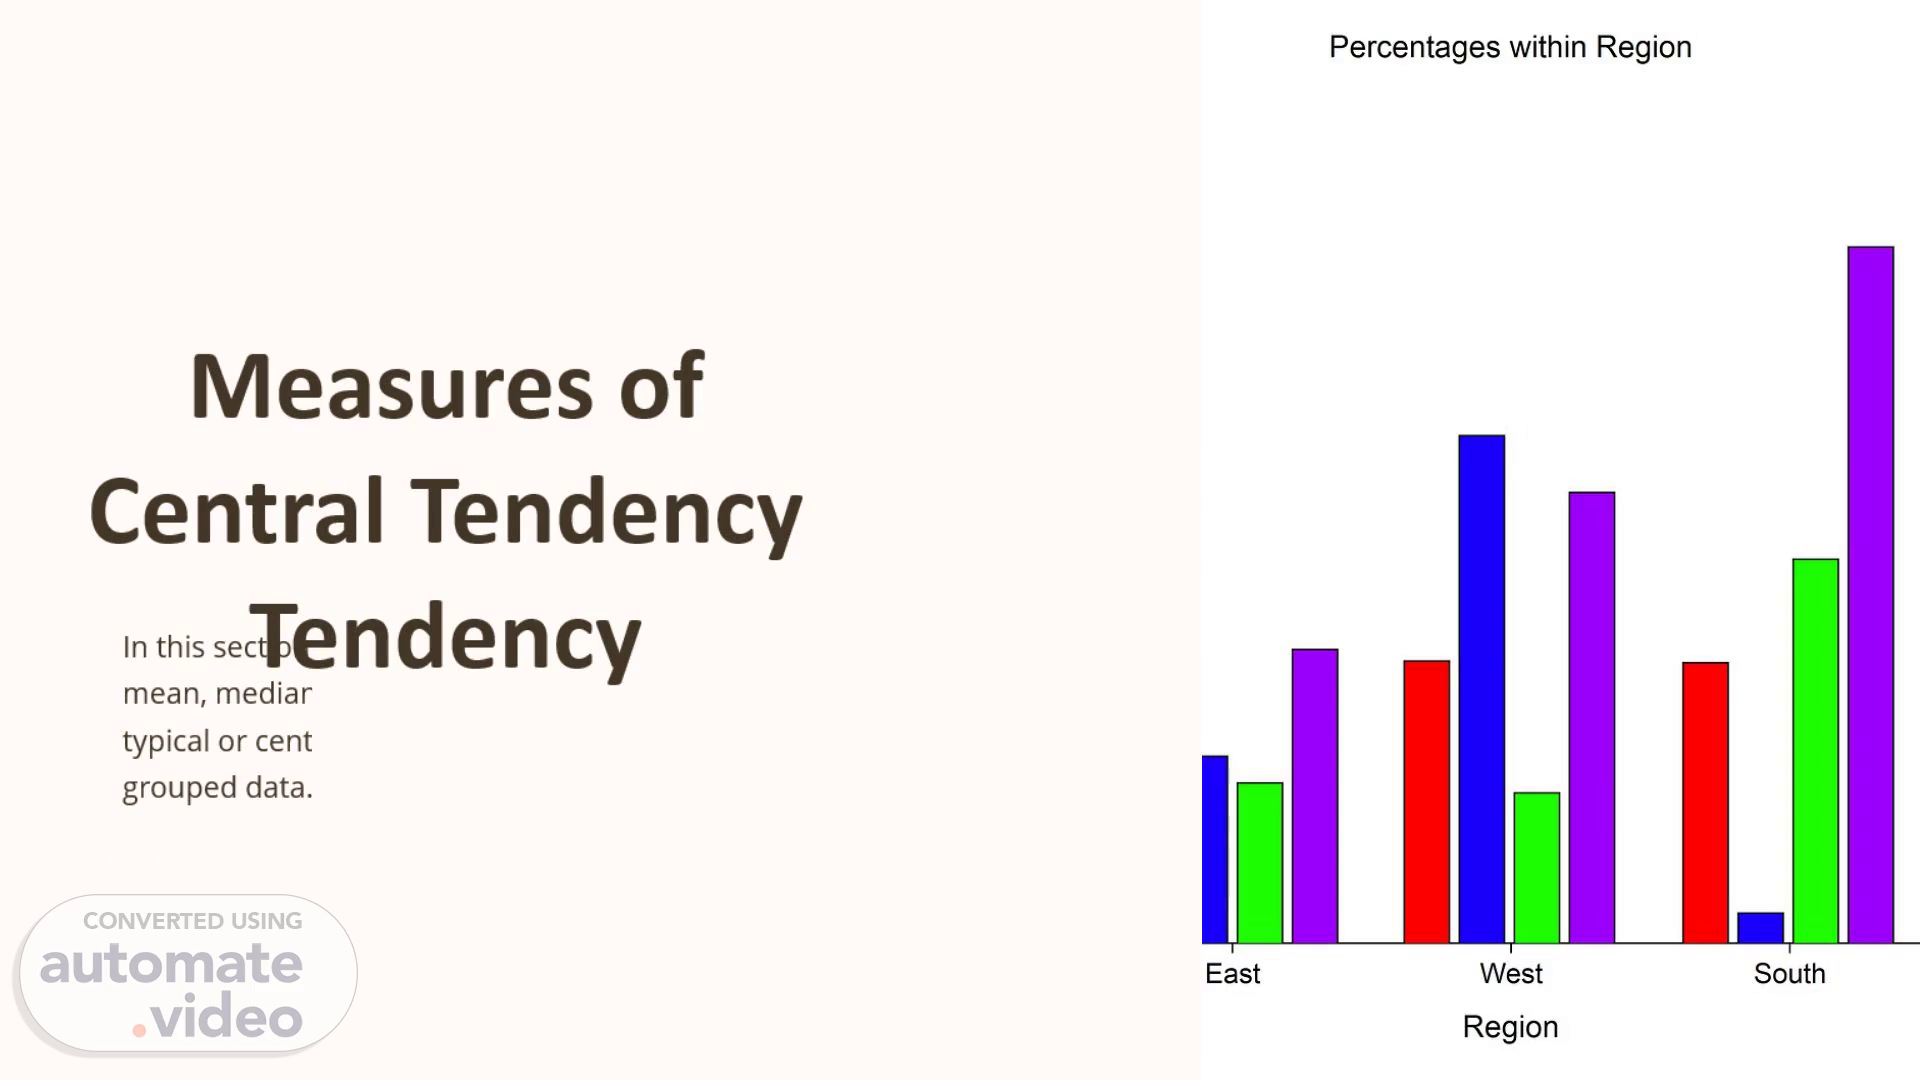
East Percentages within Region West Region South.
Scene 2 (15s)
Defining Mean, Median, and Mode. 1. Mean. The arithmetic average of a set of numbers, calculated by summing all values and dividing by the total count..
Scene 4 (42s)
[Audio] Ungrouped Data Ungrouped data refers to a collection of individual observations or measurements that are not organized into groups or classes. This type of data is often used in basic statistical analysis to calculate measures of central tendency such as the mean median and mode..
Scene 5 (1m 13s)
[Audio] Calculating the Mean of Ungrouped Data Step 1: Add up all the values Add together all the individual data points in the ungrouped data set. Step 2: Count the total number of values Determine how many total data points are in the set. Step 3: Divide the sum by the total count Divide the total sum from step 1 by the total count from step 2 to calculate the mean..
Scene 6 (1m 38s)
[Audio] Calculating the Median of Ungrouped Data Arrange Data in Order First list out all the data points in numerical order from smallest to largest. Find the Middle Value To find the median identify the middle value. If there is an even number of values take the average of the two middle numbers. Example Calculation For the data set the median is 10 as it is the middle value..
Scene 7 (2m 6s)
[Audio] Calculating the Mode of Ungrouped Data 1. Identify the values List out all the data points in the ungrouped set. 2. Count the frequencies Determine how many times each value appears. 3. Find the mode The value that appears most frequently is the mode. To find the mode of an ungrouped data set first list out all the unique values present. Then count how many times each value occurs. The value that appears the most times is the mode. The mode represents the most common or typical value in the dataset..
Scene 8 (2m 40s)
[Audio] Grouped Data When data is presented in a frequency distribution table or histogram it is considered grouped data. Analyzing grouped data requires a different approach compared to ungrouped or raw data..
Scene 9 (3m 3s)
[Audio] Calculating the Mean of Grouped Data 1. Group the data Organize the data into frequency distributions or class intervals. 2. Find the midpoint of each group Calculate the midpoint of each class interval. 3. Multiply midpoints by frequencies Multiply each midpoint by its corresponding frequency. 4. Sum the products Add up all the products from the previous step. 5. Divide by total frequency Divide the sum by the total number of data points. To calculate the mean of grouped data we first need to organize the data into frequency distributions or class intervals. Then we find the midpoint of each group multiply the midpoints by their respective frequencies sum the products and divide by the total frequency to get the mean..
Scene 10 (3m 53s)
[Audio] Calculating the Median of Grouped Data Step 1: Arrange data Group the data into class intervals and arrange the frequencies in ascending order. Step 2: Find the median class Identify the class that contains the median value using the formula: Median = (n/2)th value. Step 3: Calculate the median Use the formula: Median = L plus [(n/2 cf) / f] × c where L is the lower limit of the median class cf is the cumulative frequency before the median class f is the frequency of the median class and c is the class width..
Scene 11 (4m 34s)
[Audio] Calculating the Mode of Grouped Data Step 1 Identify the class intervals Step 2 Count the frequency of each class Step 3 Determine the class with the highest frequency To find the mode of grouped data we first need to identify the class intervals. Then we count the frequency of each class. The class with the highest frequency is the mode. This represents the value that occurs most often in the data set..
Scene 12 (5m 3s)
[Audio] Conclusion and Key Takeaways Key Takeaways Insights Continuous Learning Remember the key measures of central tendency: mean median and mode. Understanding how to calculate these for both ungrouped and grouped data is crucial for data analysis. The measures of central tendency provide invaluable insights into the distribution and central tendencies of a data set. Use them to understand your data and make informed decisions. Keep practicing calculating the mean median and mode. The more you apply these concepts the more fluent you'll become in data analysis and interpretation..