PptxGenJS Presentation
Scene 1 (0s)
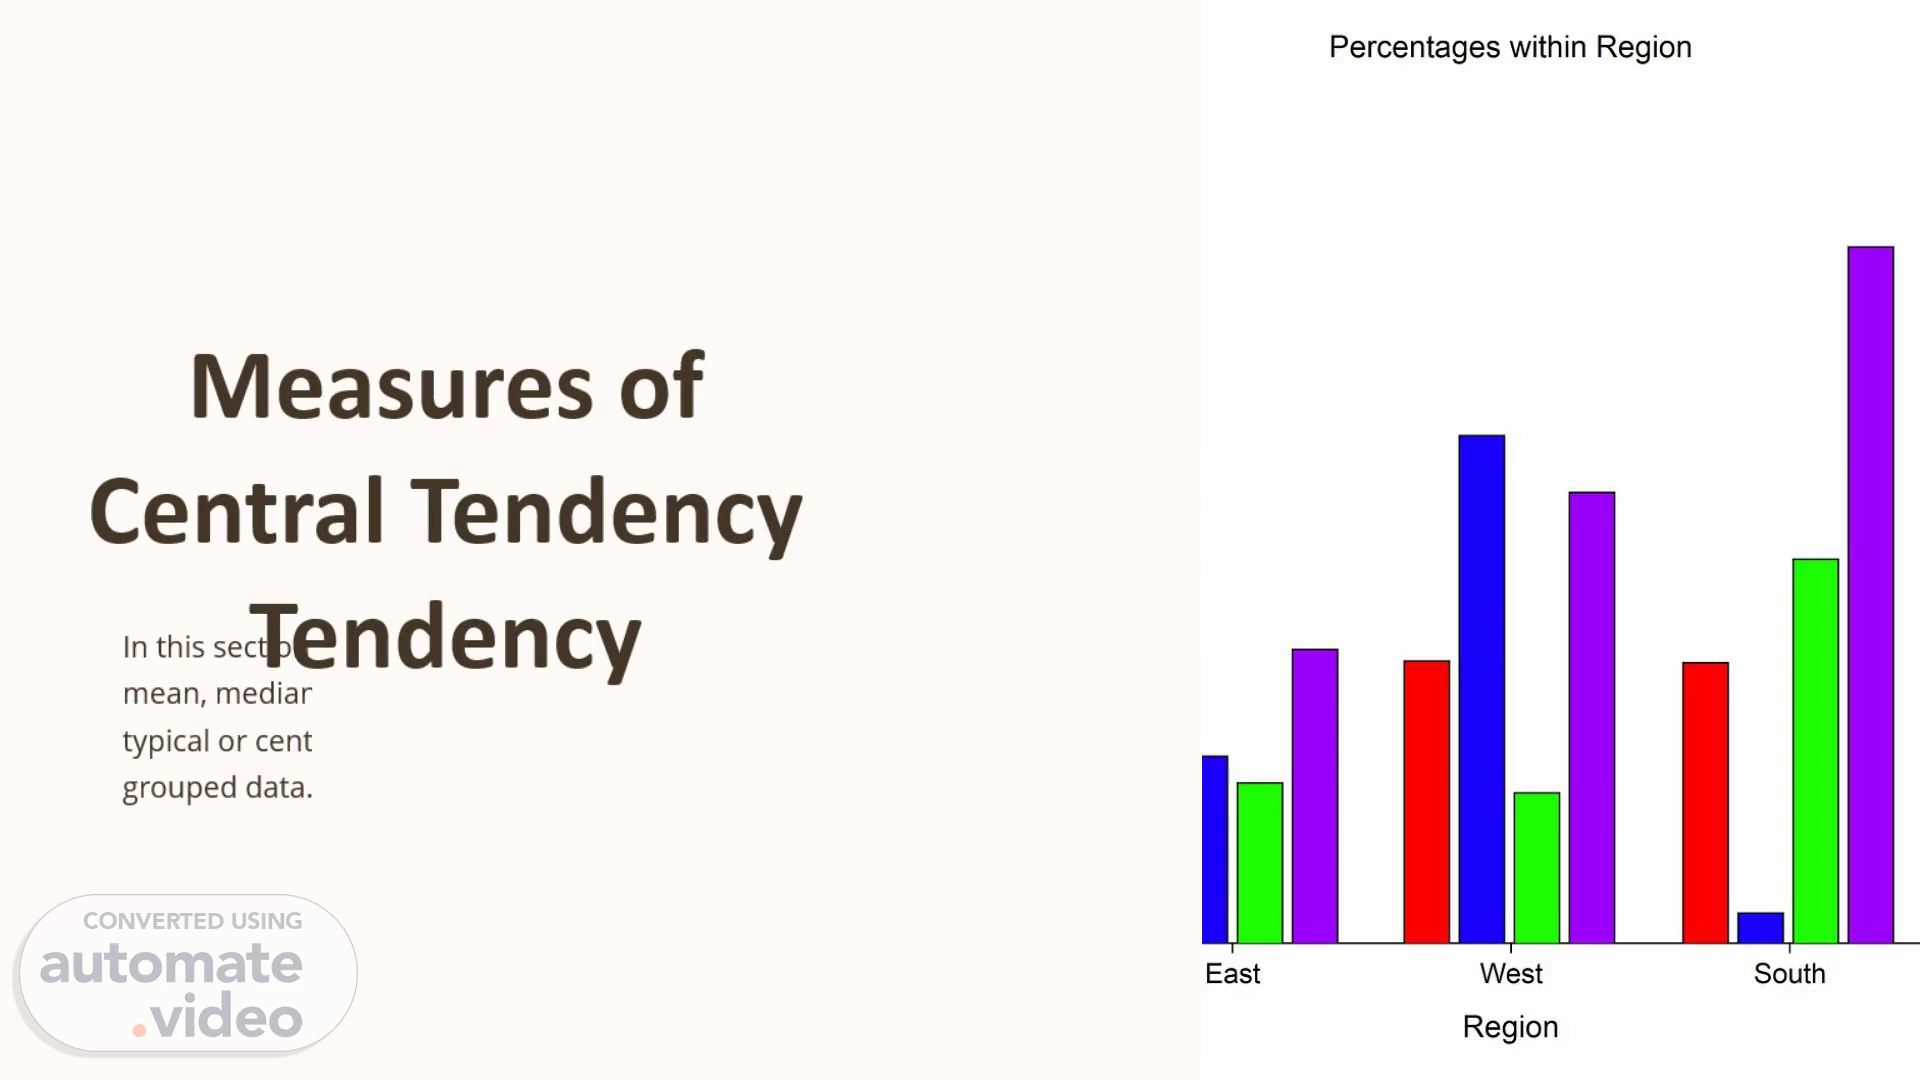
East Percentages within Region West Region South.
Scene 2 (15s)
[Audio] We are discussing the three measures of central tendency that can provide us with valuable insights into a dataset. These measures are Mean Median and Mode. Mean is the arithmetic average of a set of numbers Median is the middle value when the data is in numerical order and Mode is the value that appears most frequently in a dataset. That's all for now..
Scene 4 (44s)
[Audio] Mean median and mode are the three measures of central tendency used to calculate the most typical or central values of a dataset. Mean is the average of all values calculated by adding up all the values and dividing by the total number of values. Median is the middle number when all the values are arranged in order. Mode is the most frequently occurring value. To analyze ungrouped data it is important to understand these three measures..
Scene 5 (1m 11s)
[Audio] Add up all the individual data points in the data set determine the total number of data points in the set and divide the total sum from the first step by the total count from the second step in order to calculate the mean of an ungrouped data set. This allows us to gain insight into the typical or central values of a dataset through the three measures of central tendency which are the mean median and mode..
Scene 6 (1m 35s)
[Audio] List all the unique values present count their frequencies and the value that appears most frequently is the mode for ungrouped data..
Scene 7 (1m 44s)
[Audio] Identifying all the individual values within an ungrouped dataset and then counting the frequency of each value will help to calculate the mode of the dataset. The value appearing most frequently in the dataset is the mode..
Scene 8 (1m 58s)
[Audio] Grouped data is organized into categories or ranges such as the average monthly salary for different age groups. To gain an understanding of the typical values in a data set one can use the three measures of central tendency: mean median and mode. The mean is the average of all the values in the data set the median is the middle value in the data set when the data is ordered from least to greatest and the mode is the value that is most frequent in the data set..
Scene 9 (2m 25s)
[Audio] To understand how the data is distributed we can measure the central tendency using the three measures of central tendency: mean median and mode. To calculate the mean of grouped data we need to organize the data into frequency distributions or class intervals. Then we find the midpoint of each class interval and multiply it by its corresponding frequency. Finally we sum up the products from the previous step and divide the sum by the total number of data points for a precise calculation..
Scene 10 (2m 51s)
[Audio] Arranging the data into class intervals and frequencies in ascending order is the first step in calculating the median of grouped data. To identify the median class a simple formula should be used. After the median class has been identified the median can be calculated by increasing the lower value of the median class by the cumulative frequency of the median class divided by the frequency of the median class. Median is the middle value in a set of numbers and is one of the three measures of central tendency which gives us an insight into the core values of a dataset..
Scene 11 (3m 28s)
[Audio] In order to get an understanding of the typical values of a dataset we can use the three measures of central tendency. The mode is the value of the dataset that occurs the most frequently. To calculate the mode of data grouped into intervals we need to go through three steps. First we identify the class intervals. Secondly we count the frequency of each class. Lastly we determine the class with the highest frequency which would be the mode..
Scene 12 (3m 55s)
[Audio] Mean median and mode are powerful tools for understanding and analyzing data. We can use these measures to analyze both ungrouped and grouped data so we can gain insights into the distribution of values and the typical or central values. Practicing them regularly is the key to properly interpreting data and coming to meaningful conclusions. It is important to note that mean median and mode are valuable tools when it comes to understanding data and drawing conclusions from it..