PptxGenJS Presentation
Scene 1 (0s)
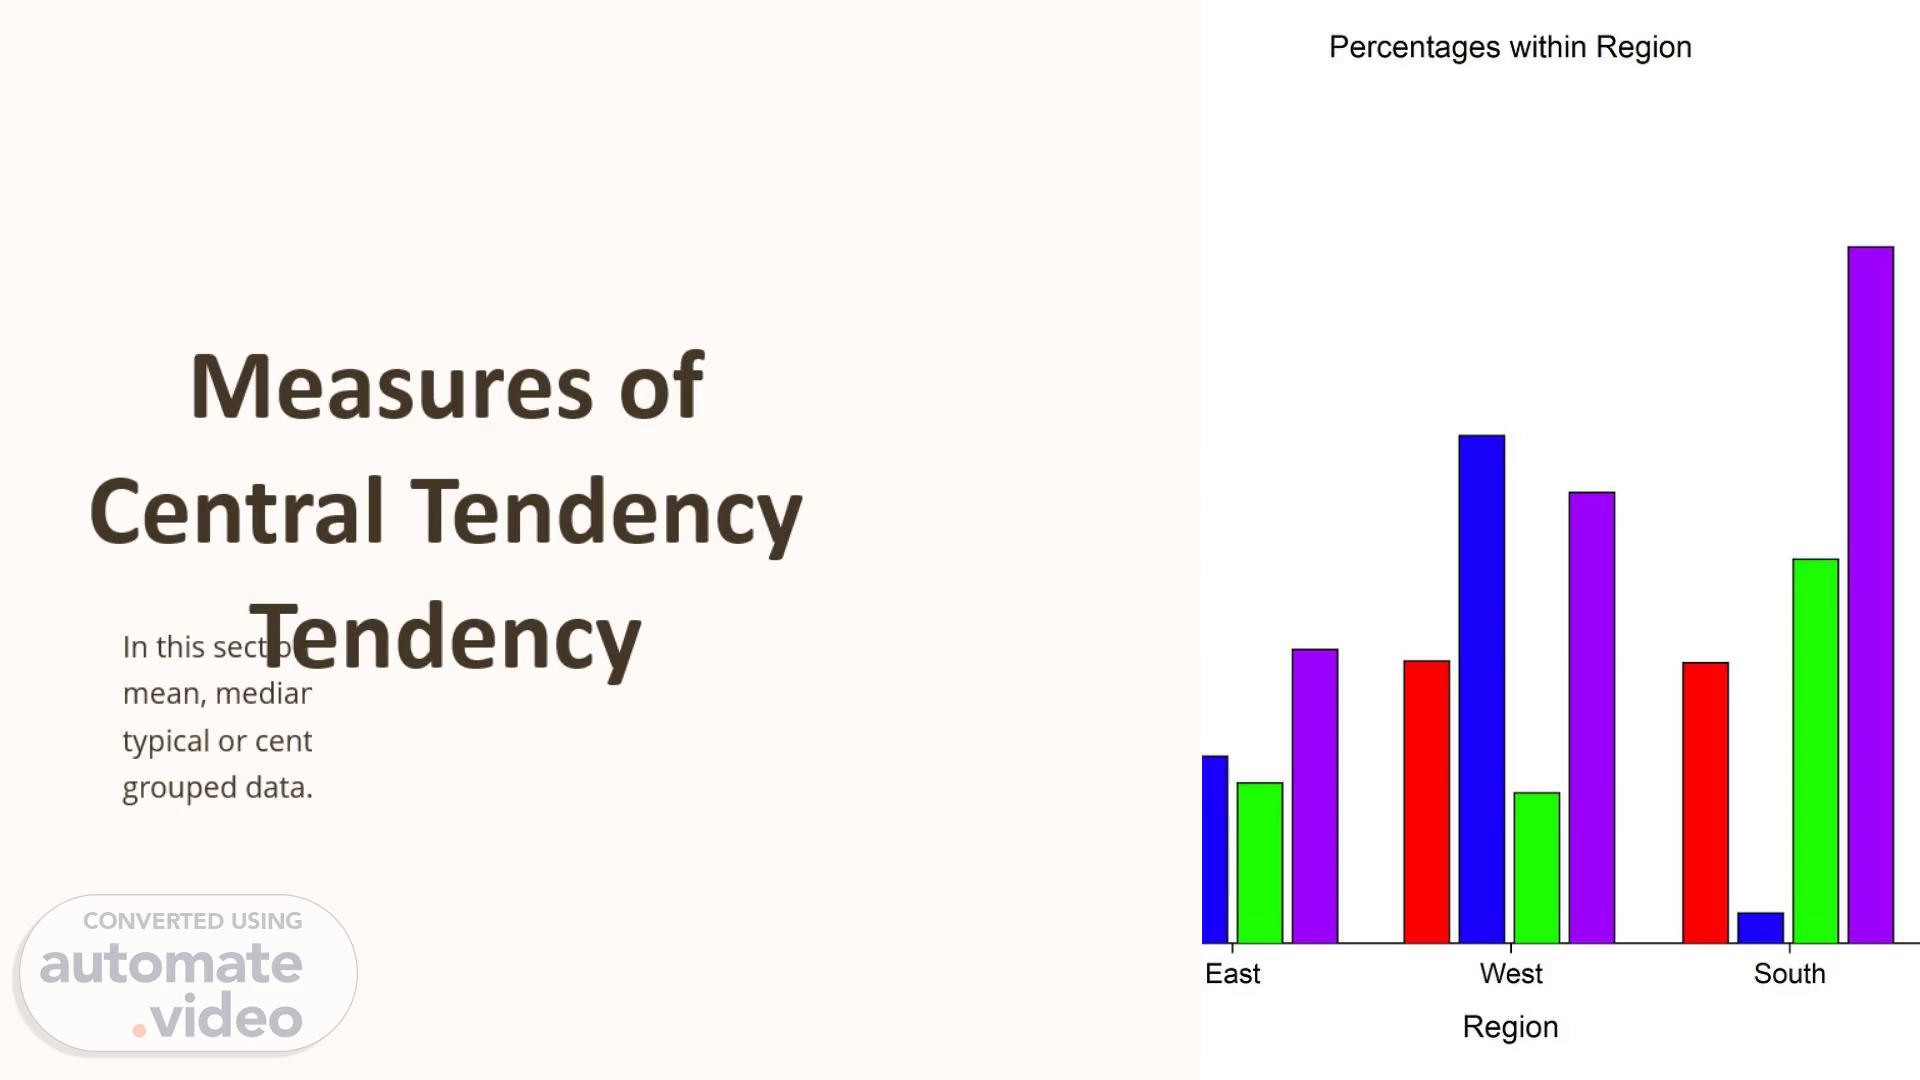
East Percentages within Region West Region South.
Scene 2 (15s)
[Audio] To better understand our data we should consider the three central measures of tendency the mean median and mode. The mean is calculated by summing all values and dividing by their count. The median is the middle value when the data is ordered in numerical order which splits the data set into two halves. Lastly the mode is the value that appears most often in the data set and there can be multiple modes in one set..
Scene 4 (48s)
[Audio] Key measures of central tendency are invaluable resources for condensing the data from a dataset. Ungrouped data is merely a compiled list of the individual values or observations. These values are then employed to find the mean median and mode. All of these calculations offer a summary of the central values of the dataset and are crucial for gaining a better comprehension of the data..
Scene 5 (1m 11s)
[Audio] Add together all the individual data points from the ungrouped data set then count the total number of values in the set. Divide the total sum from the first step by the total count from the second step to calculate the mean. This will provide a measure of central tendency alongside the median and mode to give a useful insight into the typical values of a dataset..
Scene 6 (1m 33s)
[Audio] Once you have arranged the data in numerical order from smallest to largest the median can be found which is the middle value. If there is an even number of values the average of the two middle numbers should be taken. The next slide will explain how to calculate the mode of ungrouped data..
Scene 7 (1m 50s)
[Audio] Identifying the values in the set and counting the frequency of each value are the key steps to calculate the mode of ungrouped data. The value that appears the most frequently will be the mode..
Scene 8 (2m 2s)
[Audio] Analyzing grouped data requires a different approach than analyzing ungrouped or raw data. The central tendency measures of mean median and mode give insight into the typical or center values of a dataset and help to understand the overall distribution of the data..
Scene 9 (2m 20s)
[Audio] Key measures of central tendency can tell us what values are most typical in a dataset. Three of the most commonly used central tendency measures are the mean median and mode. To calculate the mean of grouped data the following steps must be followed: group the data into frequency distributions or class intervals calculate the midpoint of each class interval multiply each midpoint by its corresponding frequency add up all the products from the previous step and finally divide the sum by the total number of data points. Knowing how to calculate the mean of grouped data can provide valuable insight into the dataset..
Scene 10 (3m 0s)
[Audio] To calculate the median the data should be arranged in ascending order and the formula used is Median=(n/2)th value. This is one of the key measures of central tendency which can provide insight into the typical value of a data set and alongside the mean and mode helps to identify the central value of the dataset..
Scene 11 (3m 22s)
[Audio] To calculate the mode of grouped data one must first identify the class intervals then count the frequency of each class and finally determine the class with the highest frequency. The mode is the score or category that appears most often in a dataset offering a useful insight into the data..
Scene 12 (3m 41s)
[Audio] As a conclusion it is important to keep in mind the key measures of central tendency: mean median and mode. Understanding how to evaluate these measures for both ungrouped and grouped data is an essential skill when analyzing data. Knowing these measures provides invaluable insights into the distribution and central tendencies of a dataset. Use them to understand your data and make wise decisions. Keep practicing calculating these measures and the more you apply these concepts to your data the more proficient you will become in data analysis and interpretation..